Presentation of single batch test results as a function of pH and L/S in reference to full characterisation data (pH dependence and percolation) for the type of material to be evaluated is very helpful in judging acceptability and understanding deviations of expected release behaviour.
In leaching, several factors play an important role in defining the concentration of a substance that will be measured under specific circumstances. Such factors are pH, liquid to solid ratio (expressed as liter of leachant in contact with given weight of solid L/S – unit L/kg), degree of contact with water, redox conditions, presence of dissolved and particulate organic matter, presence of hydrated oxide surfaces (iron, manganese, aluminium), particle porosity, etc.
In testing it is impossible to cover all these aspects at the same time. Hence characterisation tests have been developed to go beyond the single step tests that are practiced in most regulatory systems. Single step tests such as EN 12457 and TCLP (US EPA and the derivatives of this test worldwide) provide no context of the test result as illustrated in figure 1.

Figure 1. Top 3 graphs: display of EN 12457-1 (open triangle) and EN 12457-2 ( open square) test results for Mo leaching from MSWI bottom ash. Bottom 3 graphs: display of EN 12457-1 (triangle) and EN 12457-2 (square) test results for Mo leaching from MSWI bottom ash in relation to pH dependence test (EN 14429 – red dots) and percolation test (EN 14405 – blue dots).
Identification of washout vs solubility control
Plotting the same results in relation to characterisation leaching tests data (pH dependence – EN 14429 and percolation test – EN 14405) provides a lot more context (figure 2). Mo is highly soluble in MSWI bottom ash at pH > 7. Below pH 7 it is controlled by Fe2[MoO4]3 solubility. The L/S=2 results of EN 12457-1 are higher in concentration due to the fact that a substantial part of the soluble Mo is dissolved in a smaller volume of leachant at L/S=2 (left graph). The concentrations of the single step test in the concentration – L/S plot for both EN 12457-1 (L/S=2) and EN 12457-2 (L/S=10) fall above the actual concentrations measured as a function of L/S (middle graph). This is caused by the fact that the L/S=2 condition captures all Mo leached up to L/S=2. Similarly for L/S=10, the measured concentration in EN 12457-2 is the sum of all fractions analysed in the percolation test. Mo washes out readily as illustrated by the rapid decrease in concentration as a function of L/S (middle graph) and the flattening of the release curve (expressed in mg Mo/kg solid leached) after L/S=1 (graph on the right). Here the EN 12457-1 and EN 12457-2 data plot right on top of the release curve.
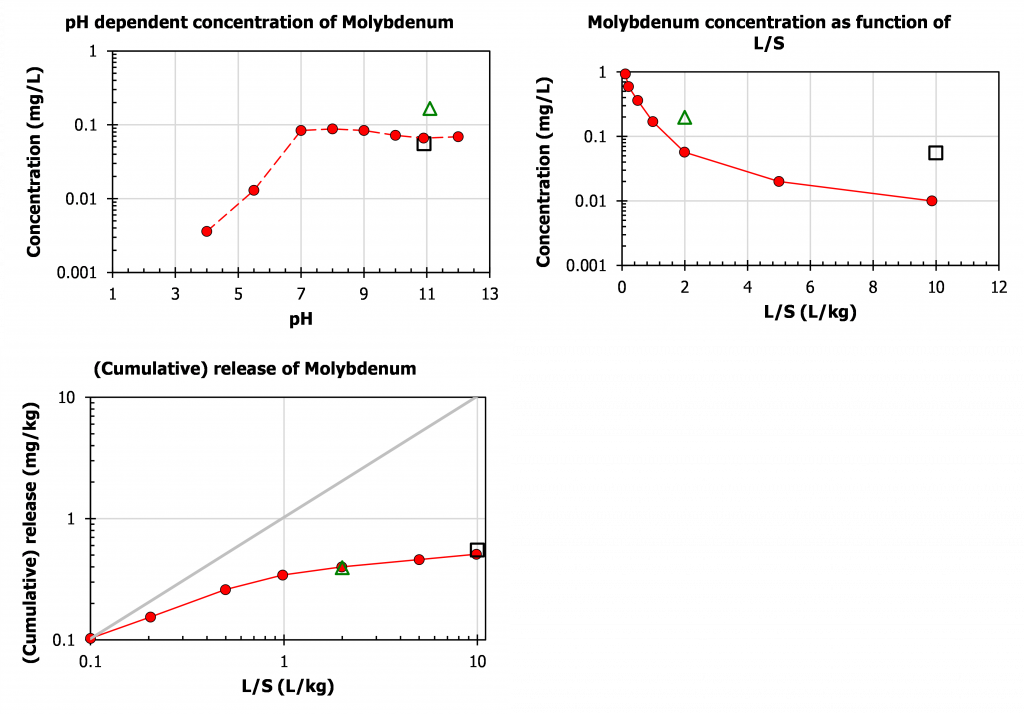
Figure 2. Display of EN 12457-1 (triangle) and EN 12457-2 (square) test results for Mo leaching from MSWI bottom ash in relation to pH dependence test EN 14429 (red dots) and percolation test EN 14405 (blue dots).
In case of solubility control such as for Al leaching from MSWI bottom ash (figure 3), the measured concentrations at L/S=10 plot right on top of the concentration as a function of pH (top left graph). The release plot in mg/kg (left bottom) follows a straight line with slope about 1, which means that provided the pH does not change too much the same concentration is found irrespective of L/S. As can be seen also, there is a pH effect, which is nicely captured in the corresponding shape of the concentration curve as a function of L/S (bottom right) and the pH curve of the percolation test as a function of L/S (top right).
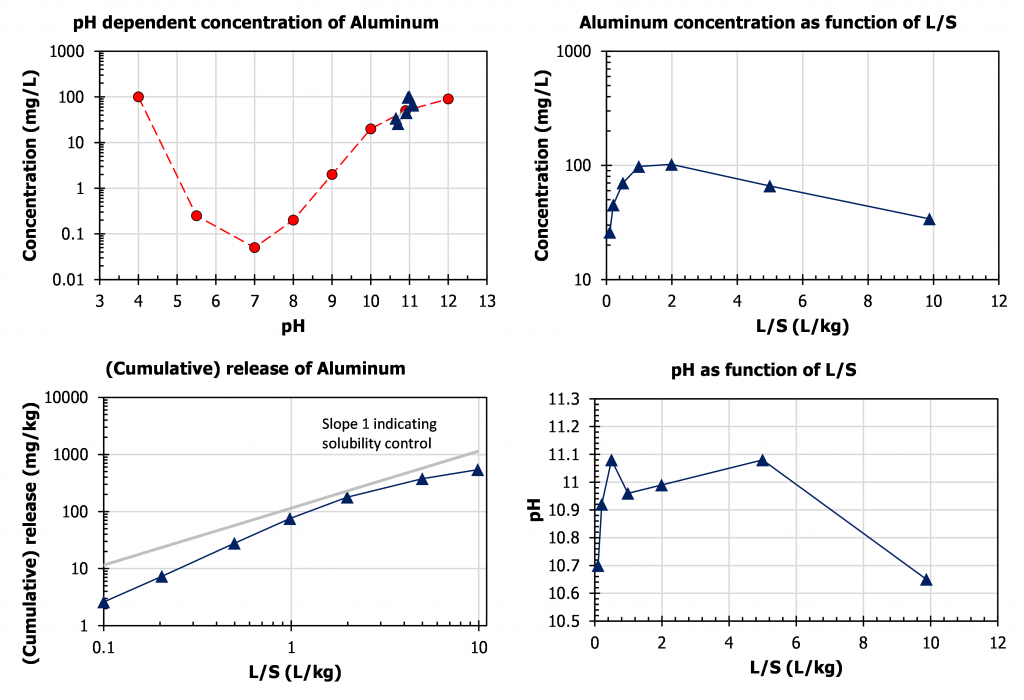
Figure 3. Leaching of Al from MSWI bottom ash as a function of pH and L/S to illustrate release controlling factors.
Geochemical speciation providing insight in solubility controlling phases
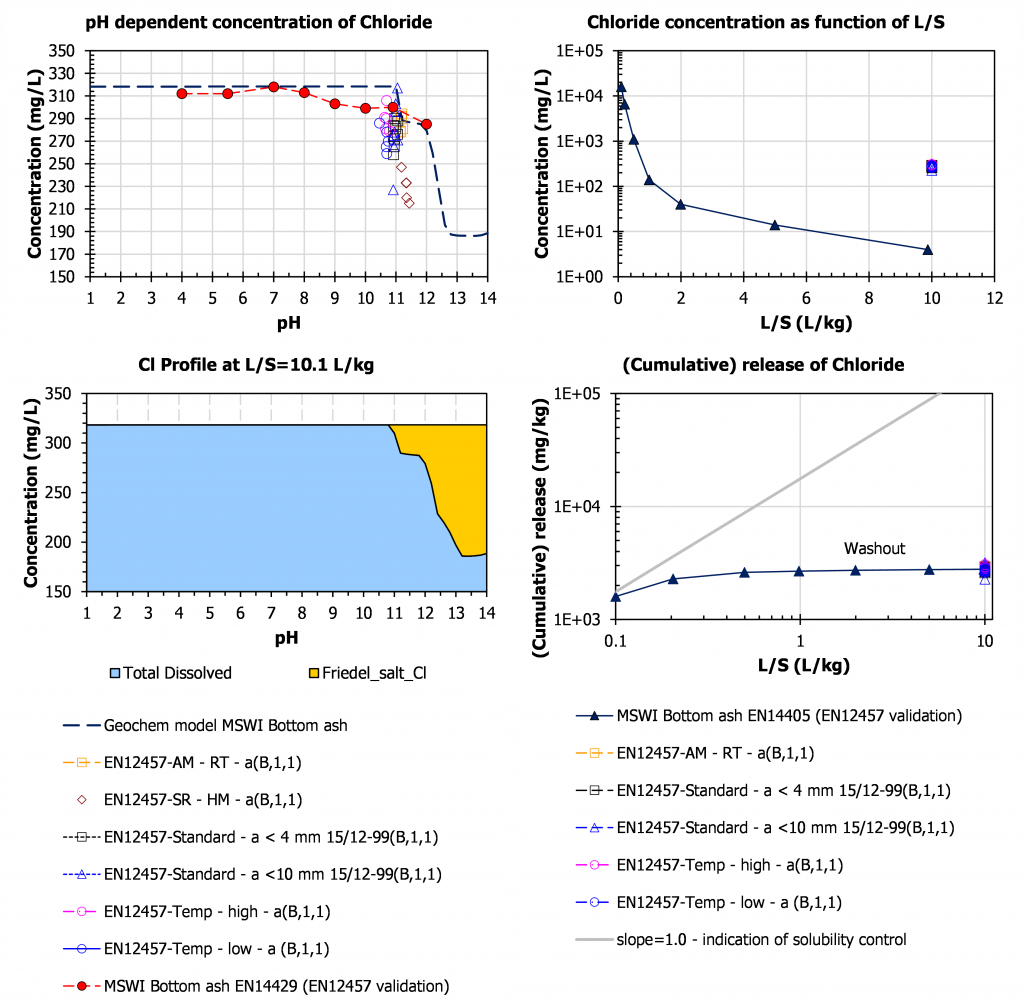
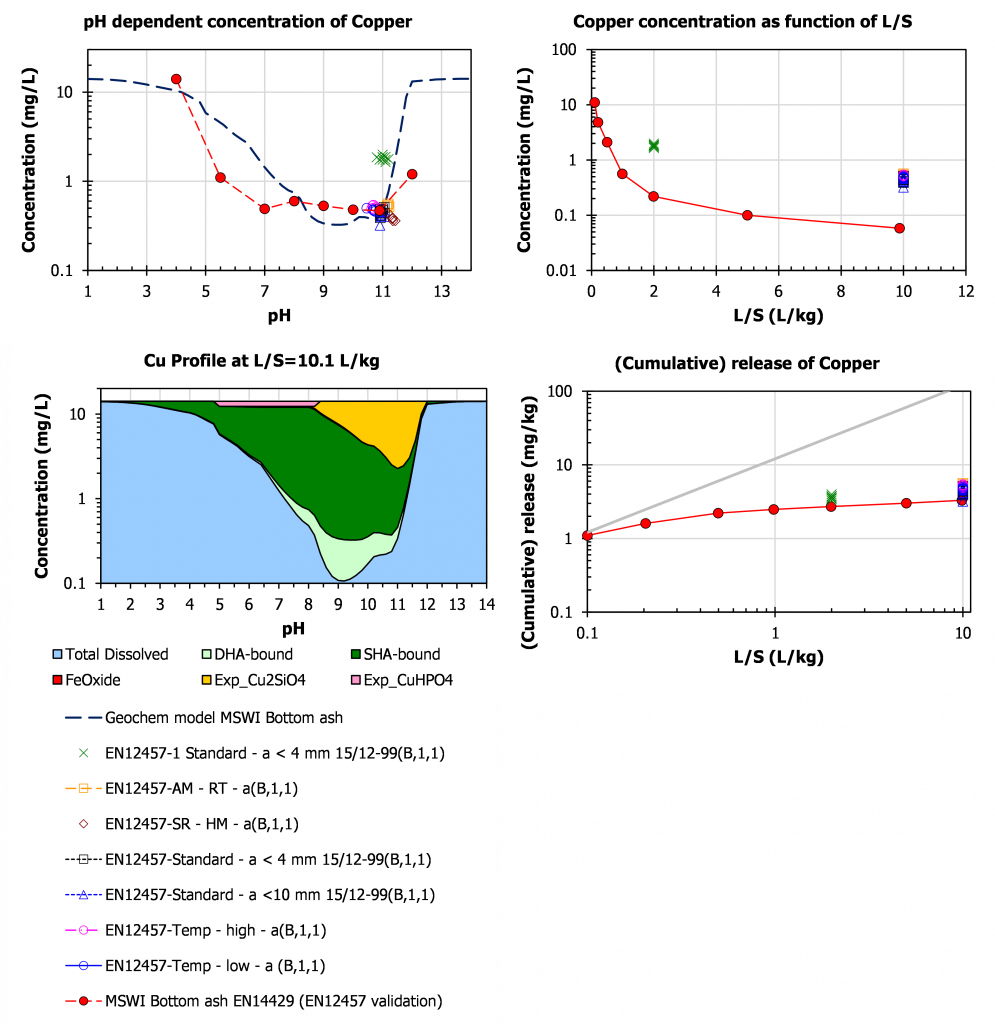
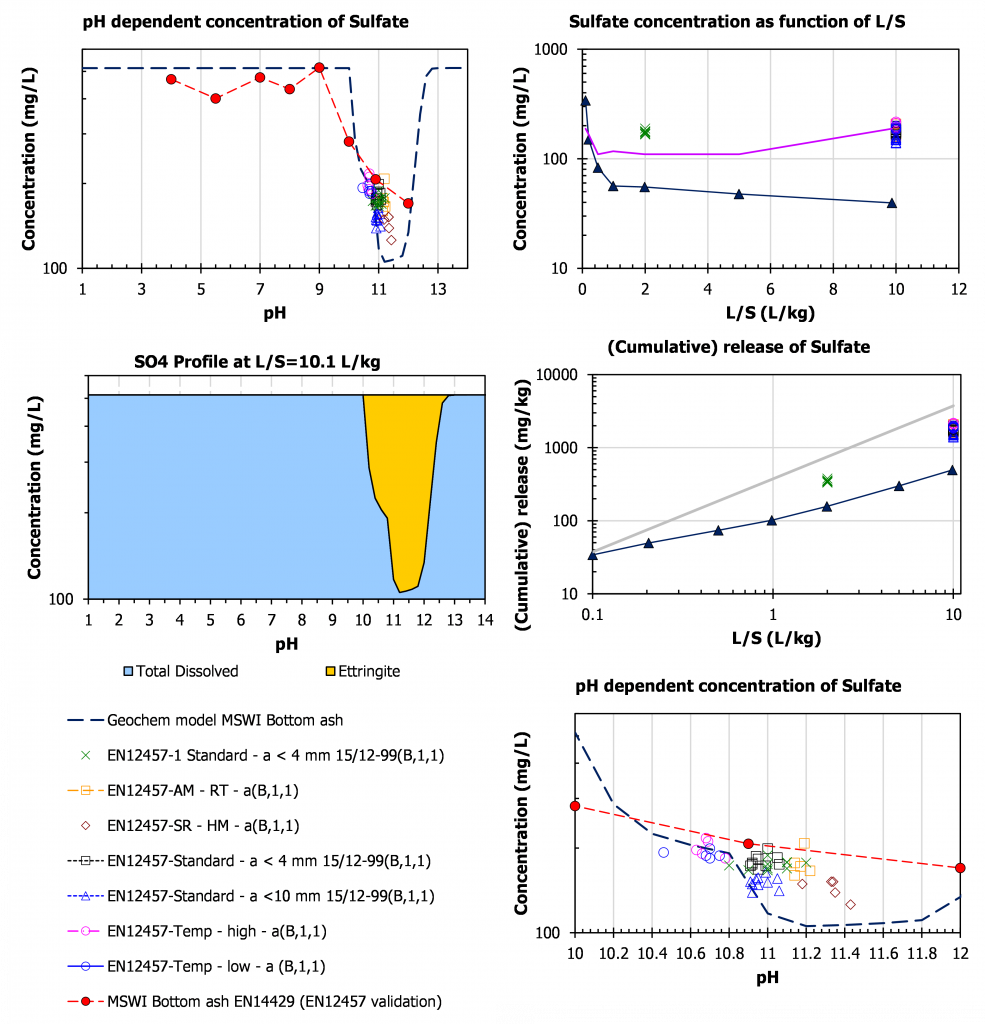
In the following 4 figures results from the intercomparison validation work on the EN 12457 series is shown in perspective to the characterisation leaching test and results from geochemical modelling of the MSWI bottom ash used in the validation study to obtain insight in the nature of the release controlling phases and sorptive phases.
Chloride
For Cl, it can be seen that Friedel salt is a controlling phase at high pH, be it only for a small portion of the available content (some 40 %). Upon carbonation that phase readily dissolves and all Cl– present will leach out. The results of ruggedness validation align along the pH domain of solubility control indicating that even for a highly soluble substance as chloride pH control cannot be ruled out.
Copper
For Cu, a Cu-DOC complex (light green) is highly soluble at a level of about 0.3 mg/l, which means about 3 mg/kg at L/S=10. By far the most part of the Cu available for leaching is retained with in the matrix unless pH conditions change drastically (either more acidic or more alkaline).
Sulphate
In case of sulphate, the release is controlled by Ettringite between pH 10 and 13. This is precisely the domain in which the ruggedness validation was carried out. Again, also here test data for different experimental conditions align to a large degree with the pH behaviour, which makes it complicated to separate effects of the imposed change and the pH effect possibly caused by the change in test conditions. The purple line in the top right concentration vs L/S graph is a model prediction assuming solubility control by ettringite. The last data point can be somewhat off due to carbonation in the collection bottle of the percolation test. Uptake of CO2 in the alkaline eluate resulting from percolation is well known and can be substantial when CO2 in the laboratory atmosphere is increased by carbonation experiments or other CO2 producing activities in the laboratory environment.
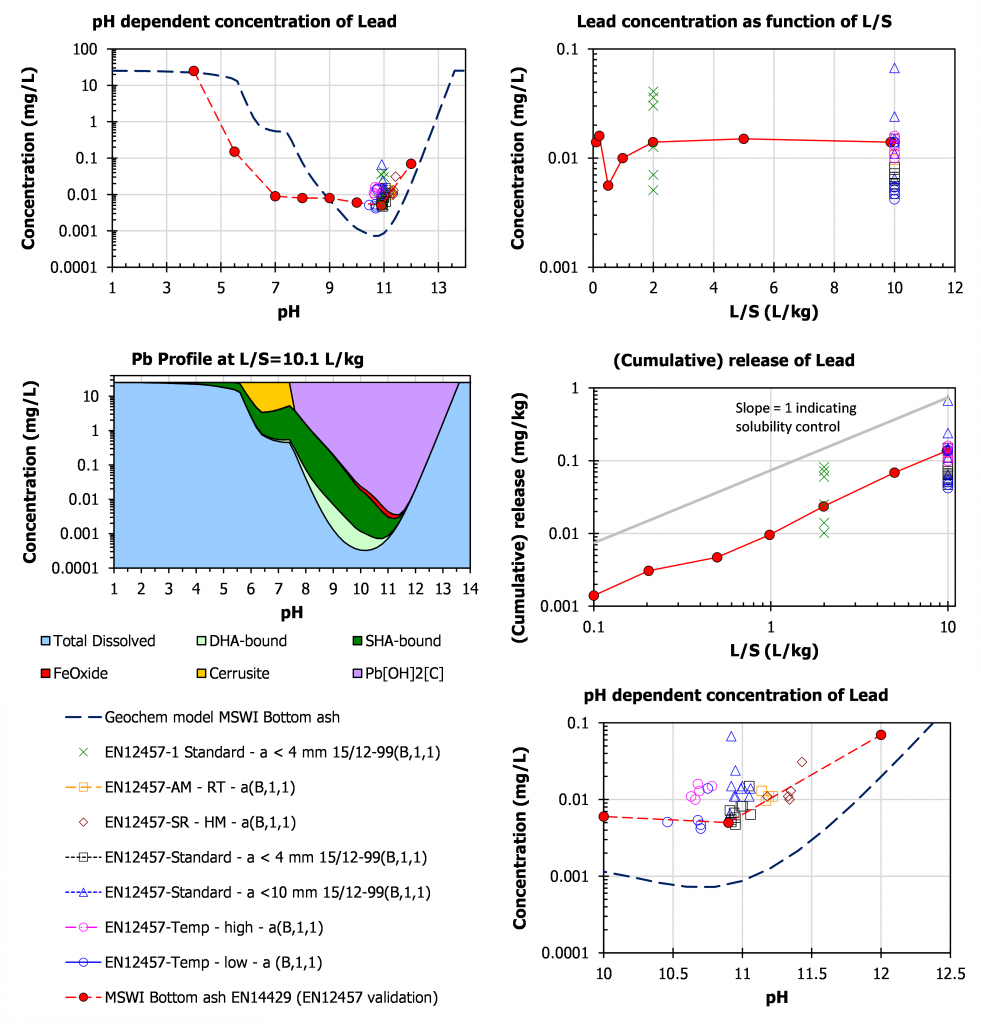
Lead
For Pb, the leaching is relatively high at high pH. Very fresh ash may feature an own pH of 12.5 and in specific cases over 13 in case substantial amounts of shells have been co-combusted. The Pb concentration drops to very low levels below pH 11 and remains low down to a pH of around 7-8. This implies that Pb often flagged as a major issue in bottom ash is hardly of relevance from a leaching perspective once the ash has been carbonated to below pH 11. Pb[OH]2 and Pb complexation with particulate organic matter are the most prominent solubility controlling phases.