Relation concentration and RSDr and RSDR for content organic contaminants
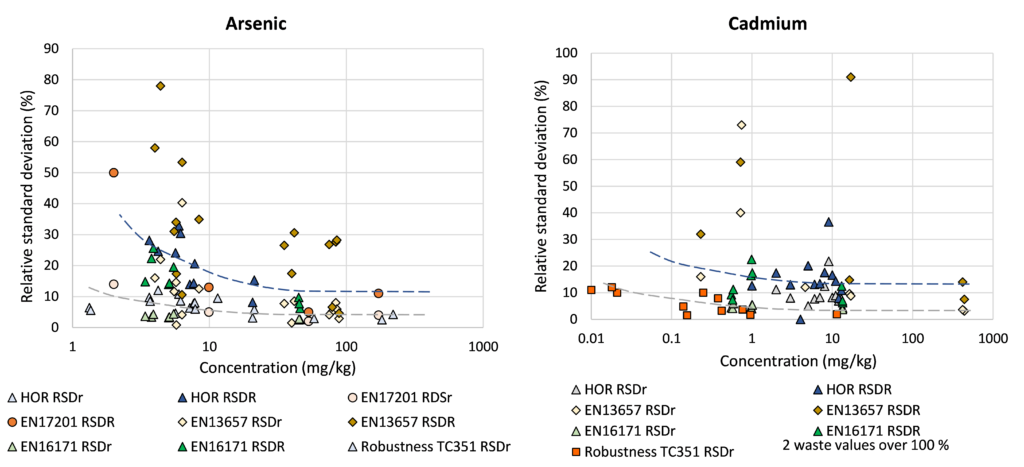
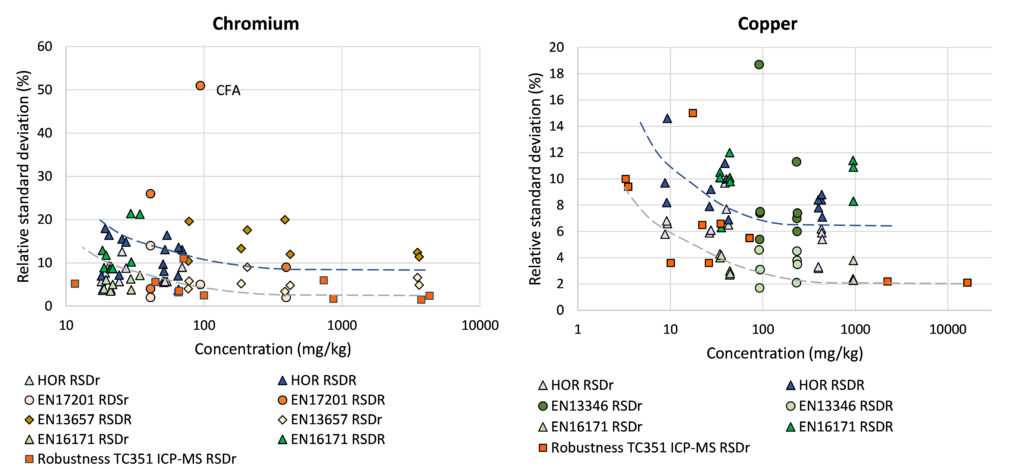
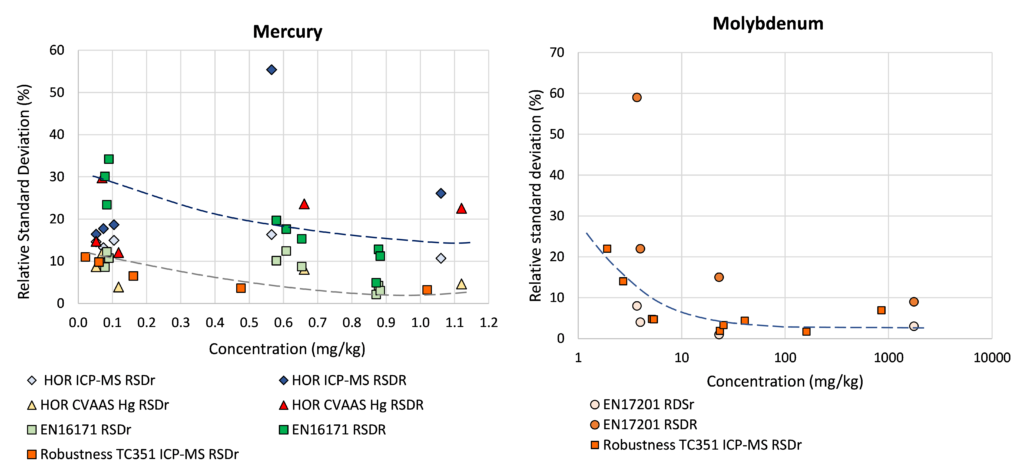
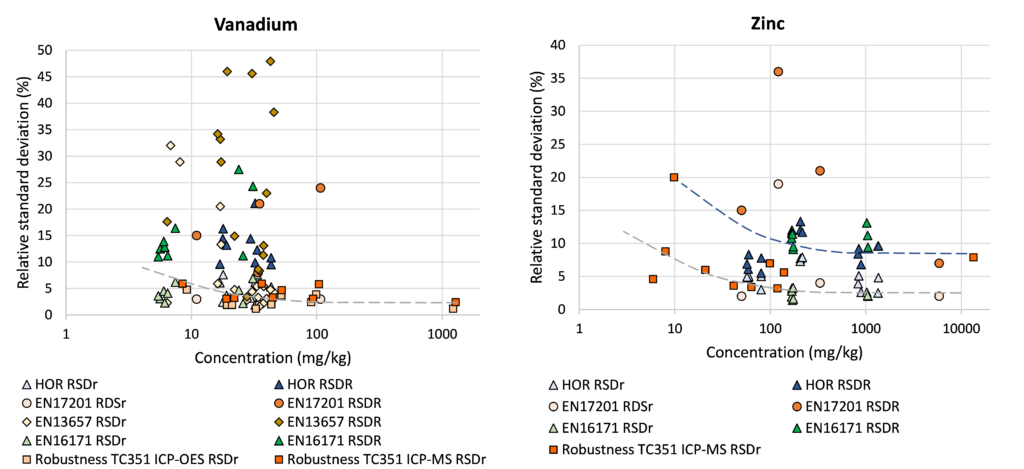
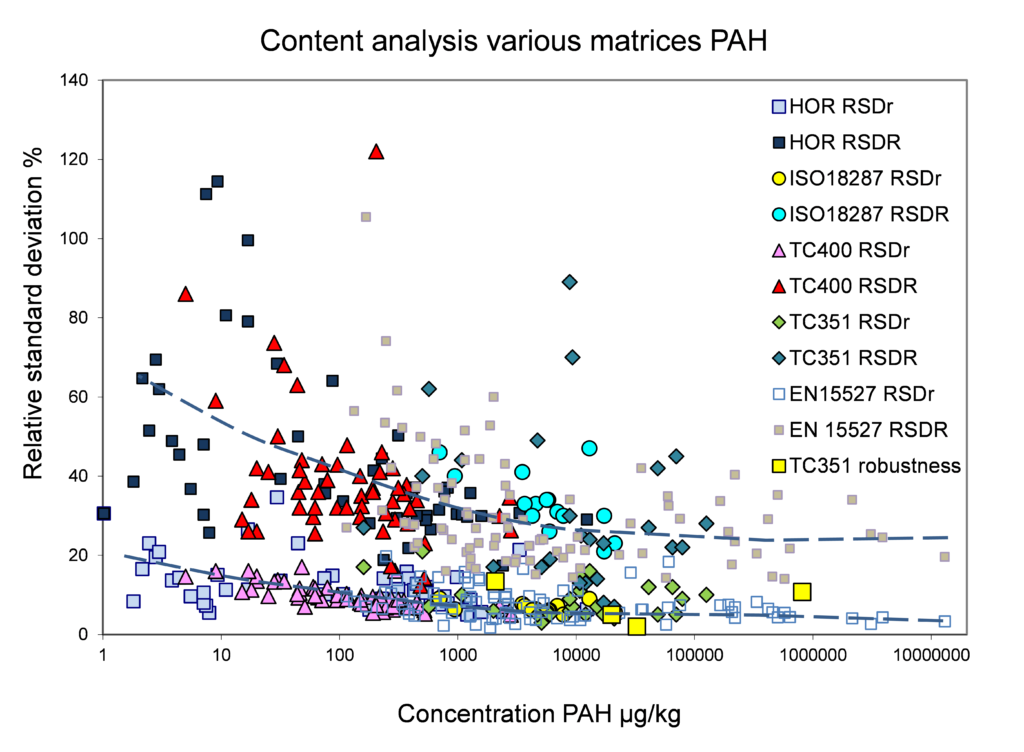
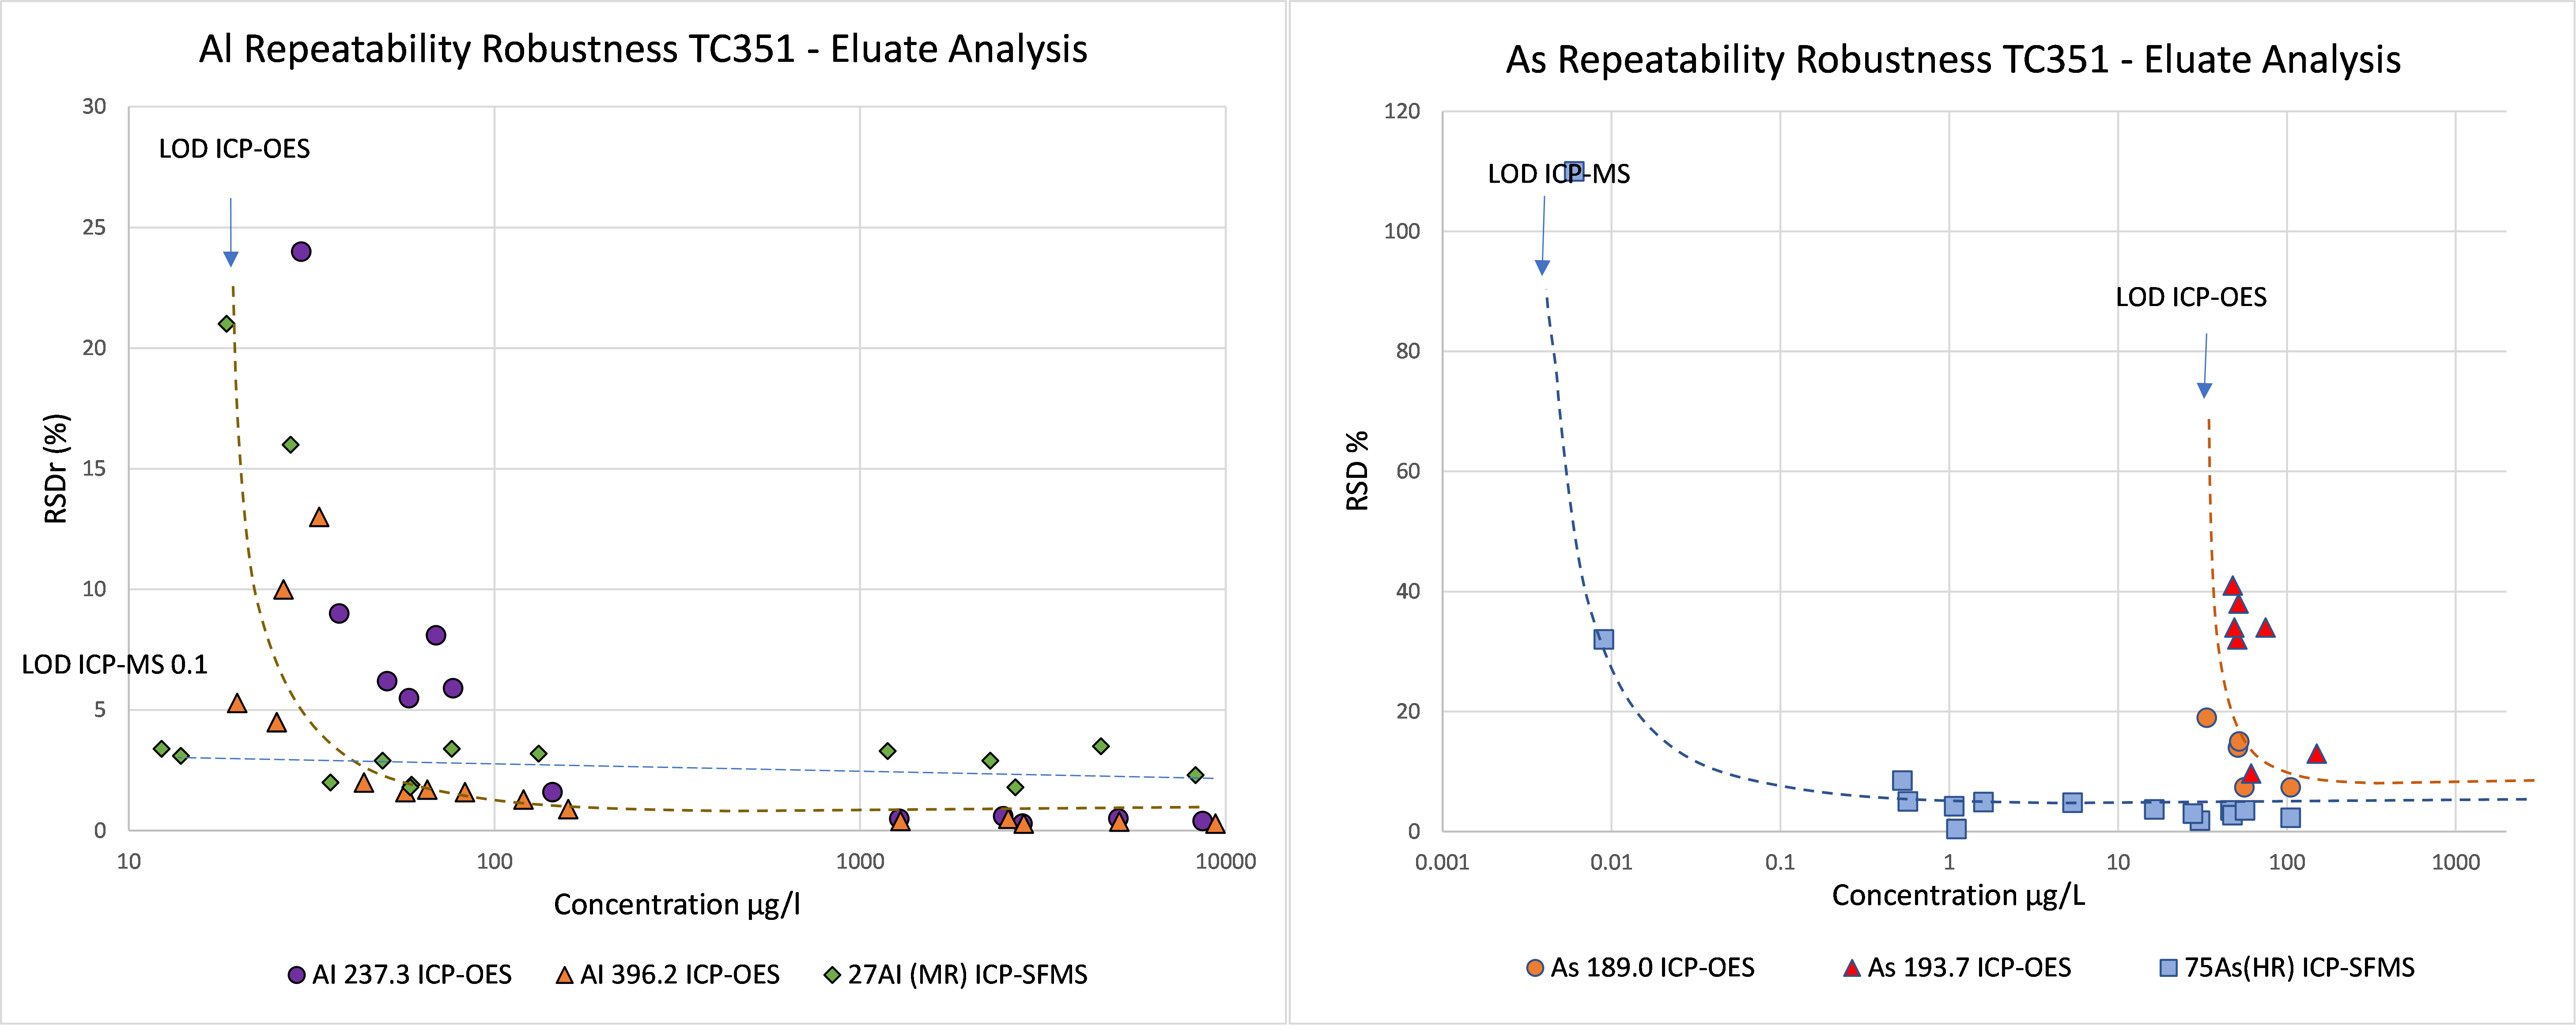
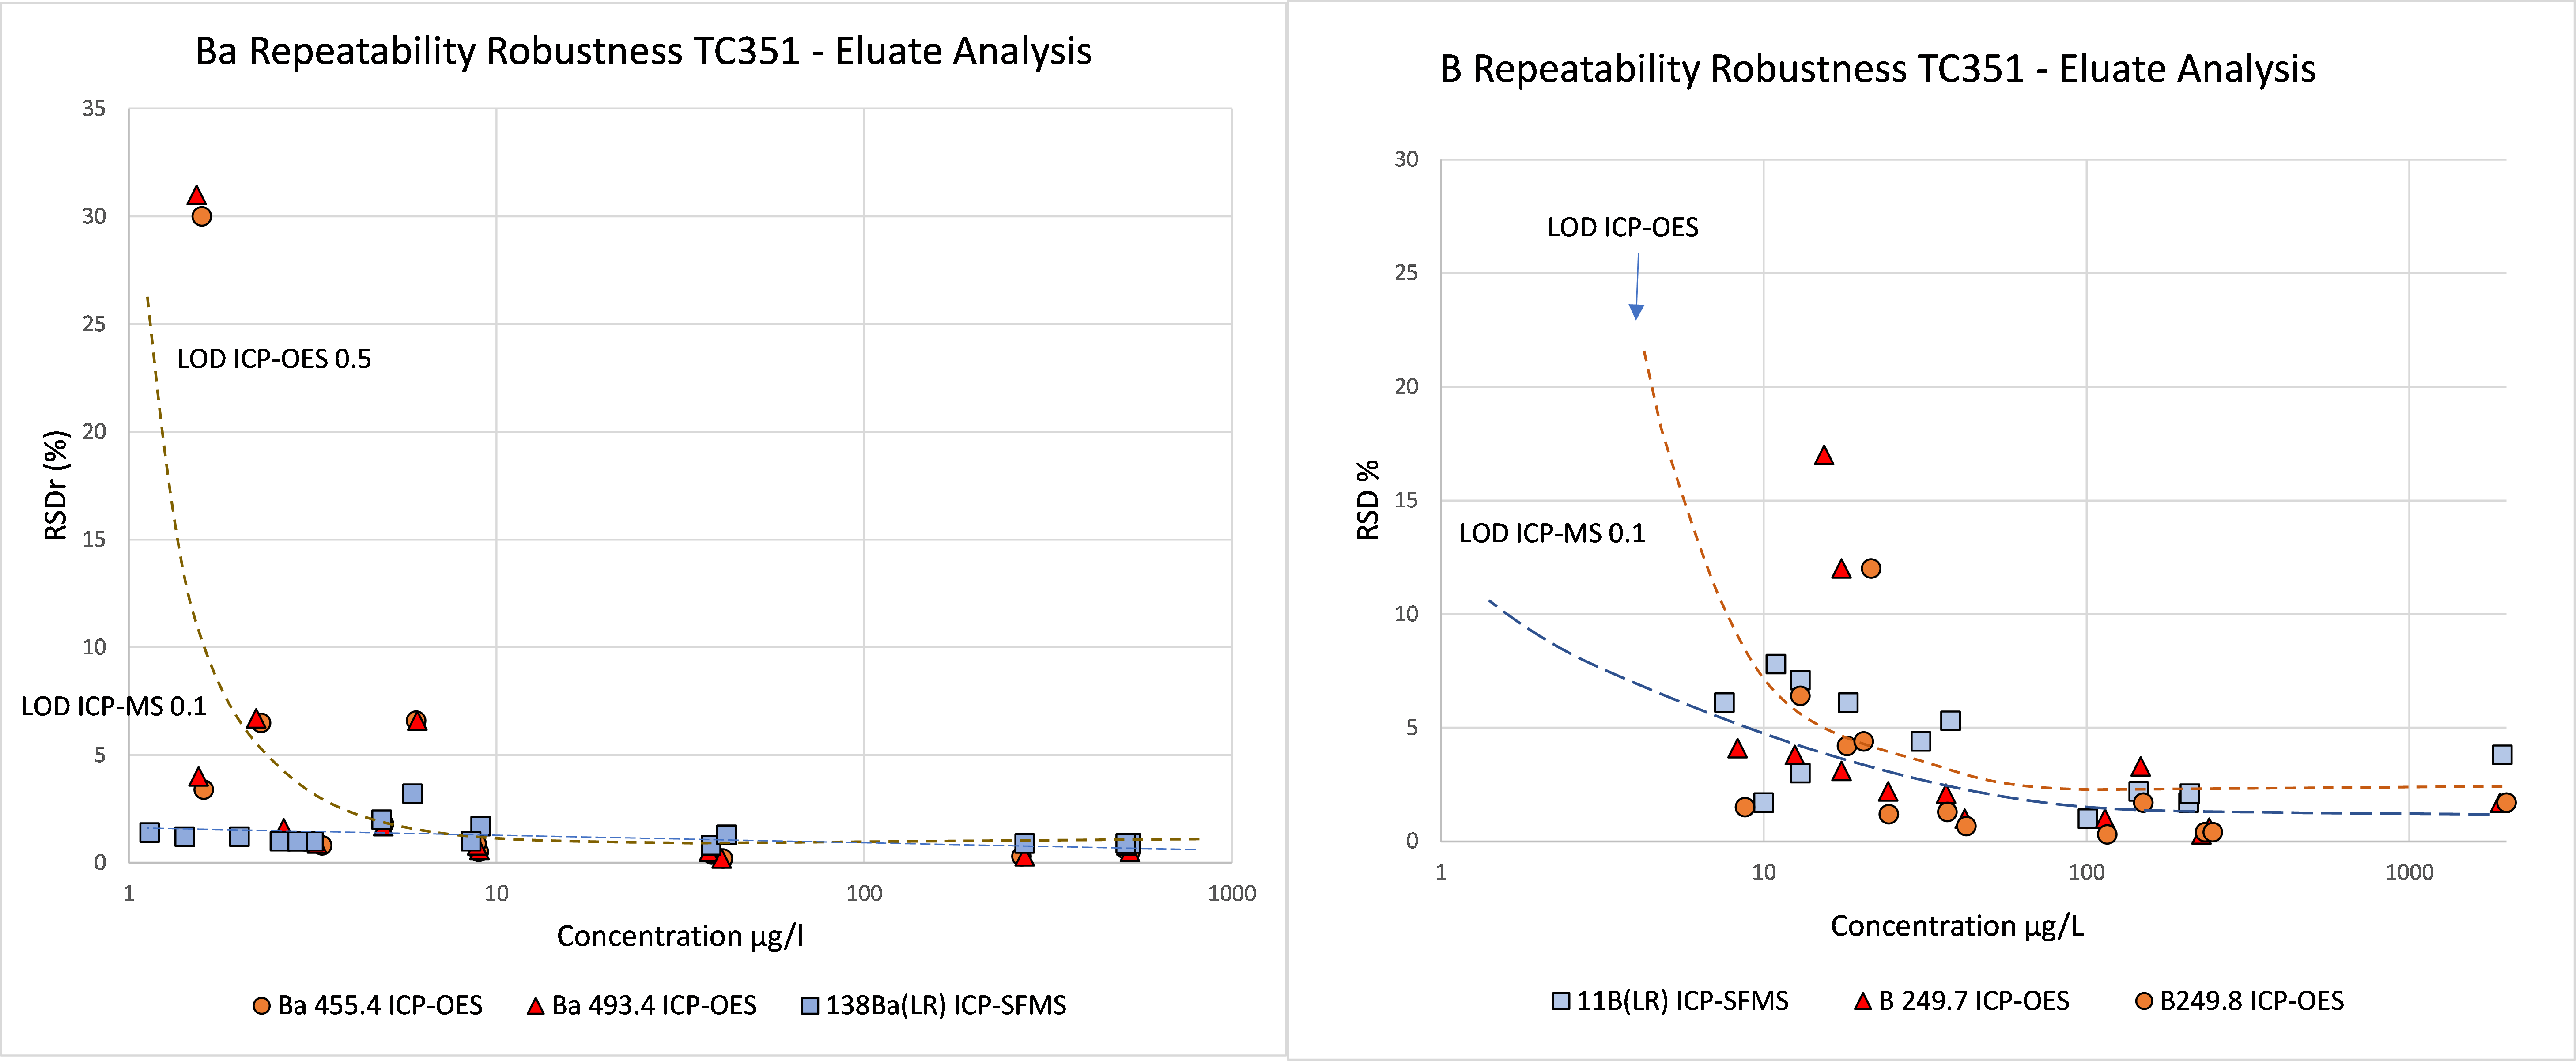
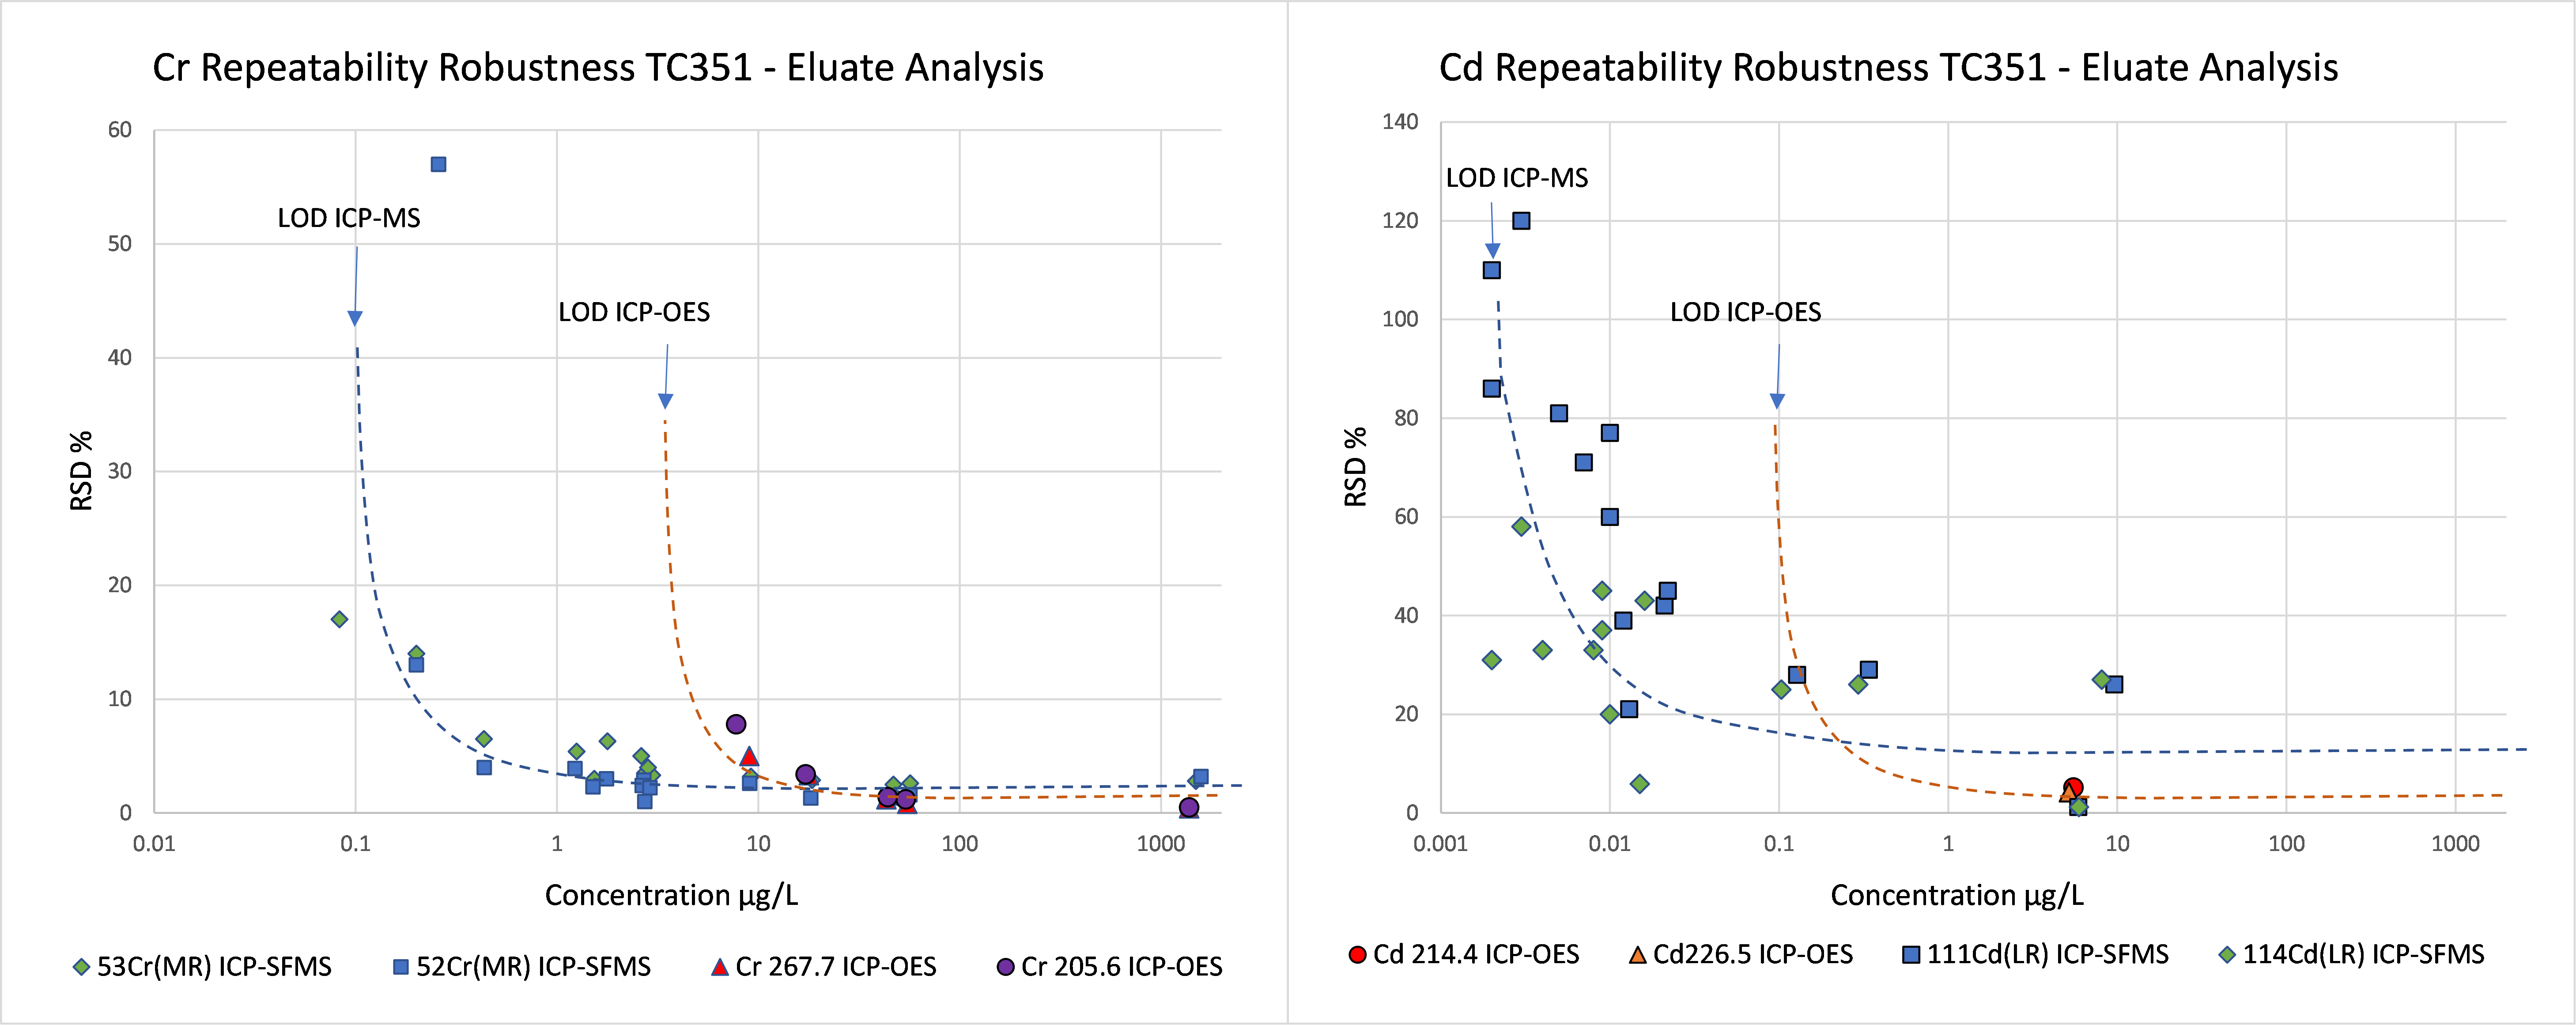
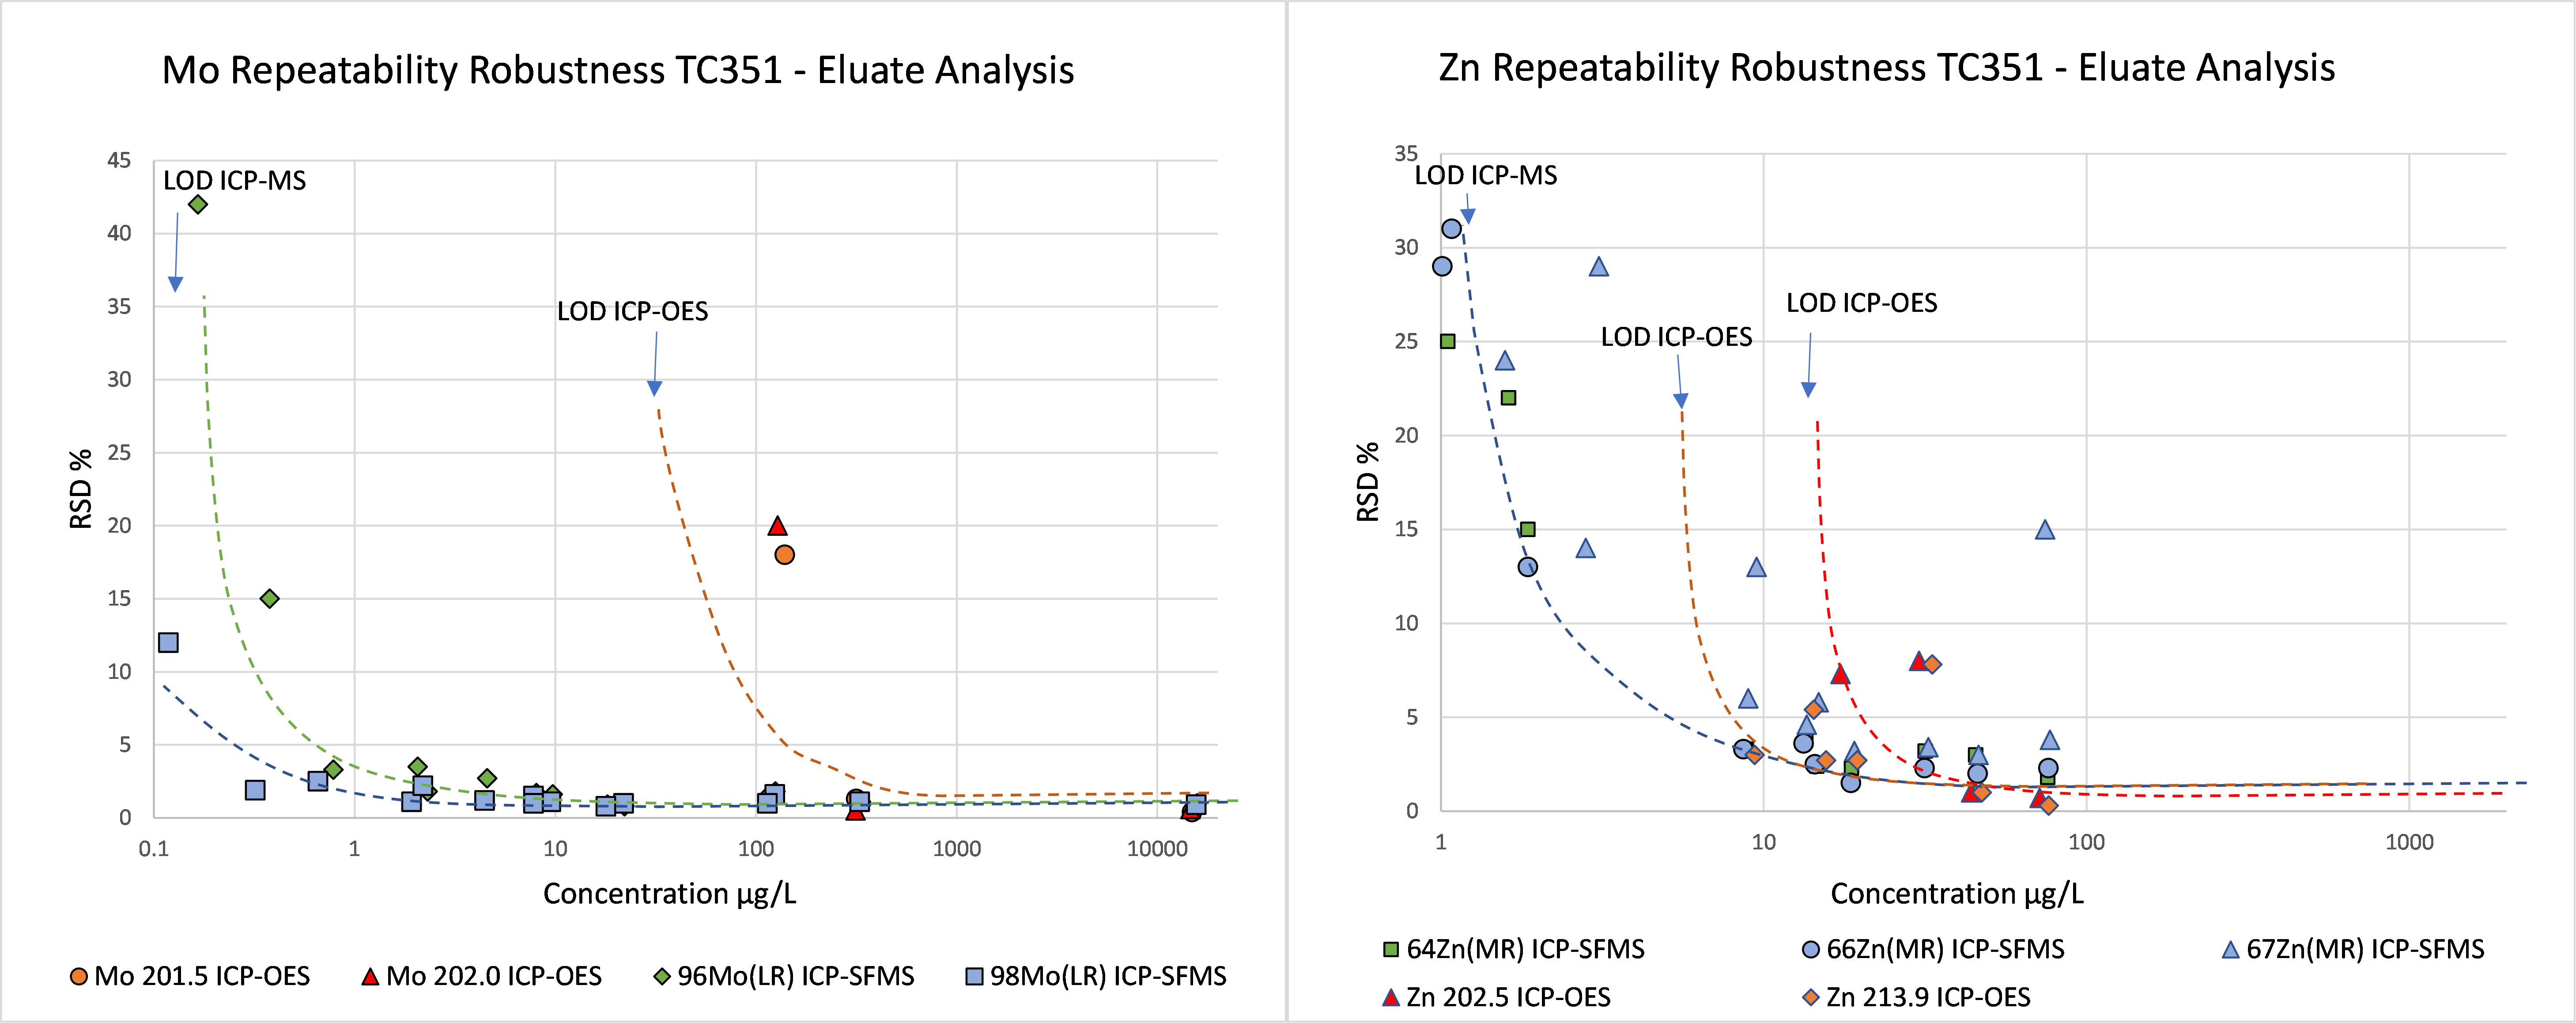
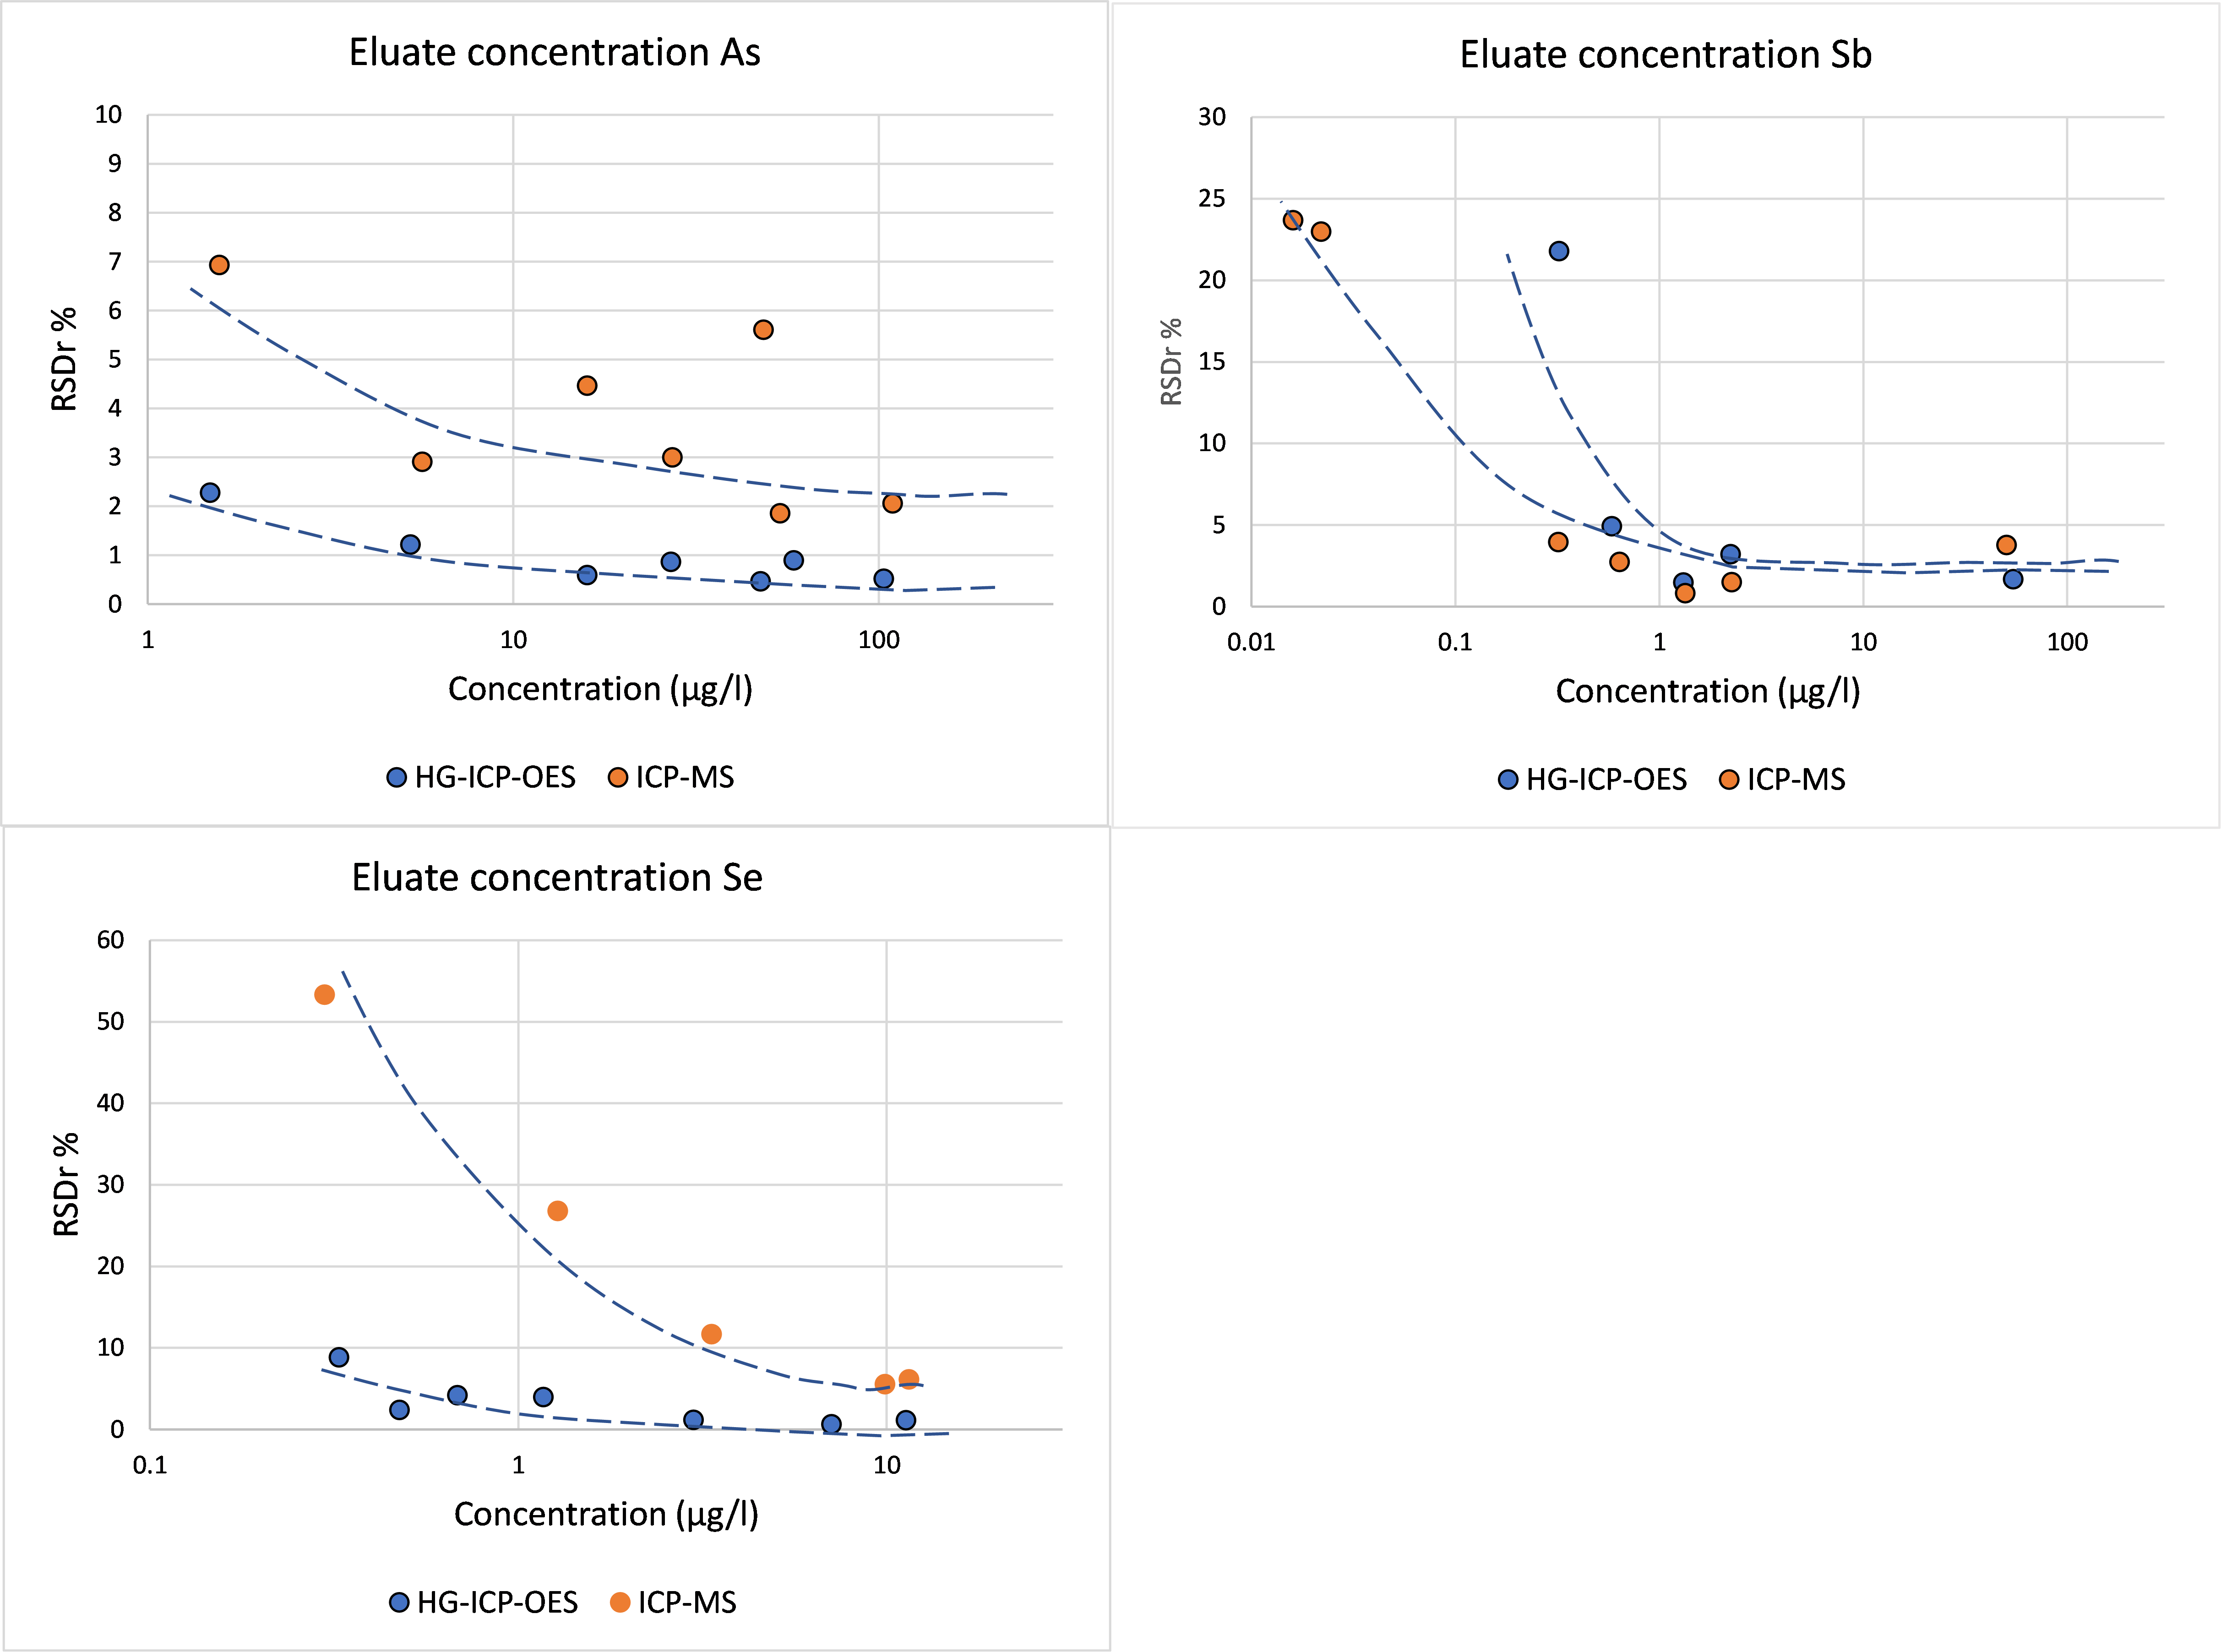
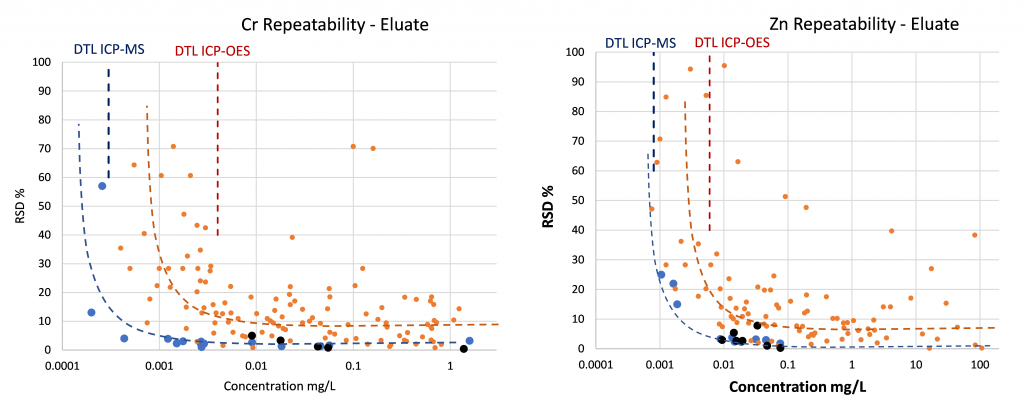
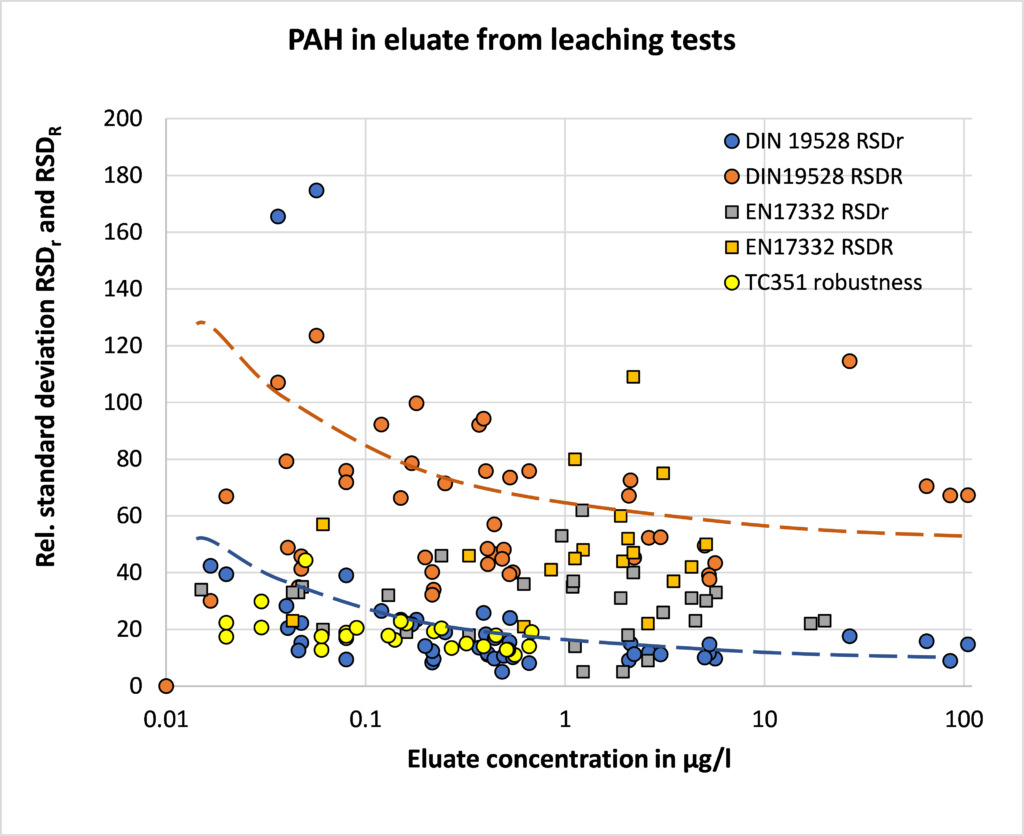
In the figures below, the relationship between the concentration and relative repeatability standard deviation (RSDr) and relative reproducibility standard deviation (RSDR) is given for the content analysis of organic contaminants in soils, sludge, waste, biowaste and construction products. Apart from some obvious outliers, there is a clear increase in RSDr and RSDR as the concentration decreases. This matches with the relationship defined by Horwitz and Albert (2006). The consistency of the performance across fields indicates that comparison of performance data in tabulated form does not sufficiently consider the role of concentration level in in performance.

Figure 1. Relative repeatability and reproducibility standard deviations for validation studies for PAH (polyaromatic hydrocarbons) content in soil, sludge, biowaste, waste and construction products.

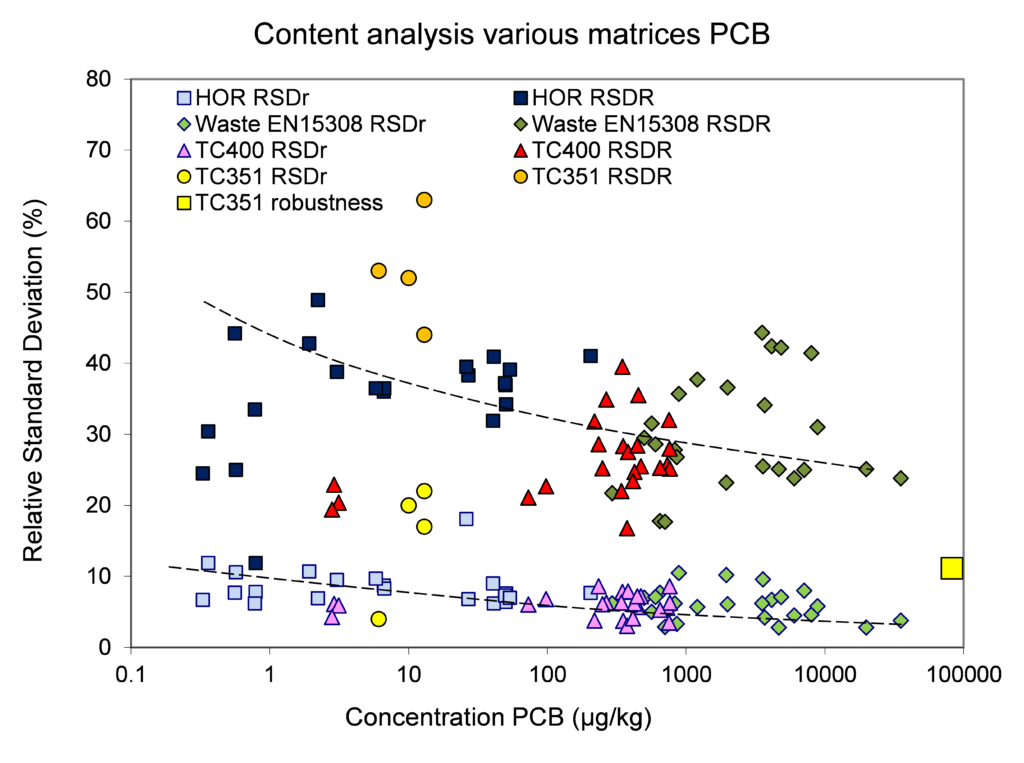
Figure 2. Relative repeatability and reproducibility standard deviations for validation studies for PCB (polychlorobiphenyls) content in soil, sludge, biowaste, waste and construction products.

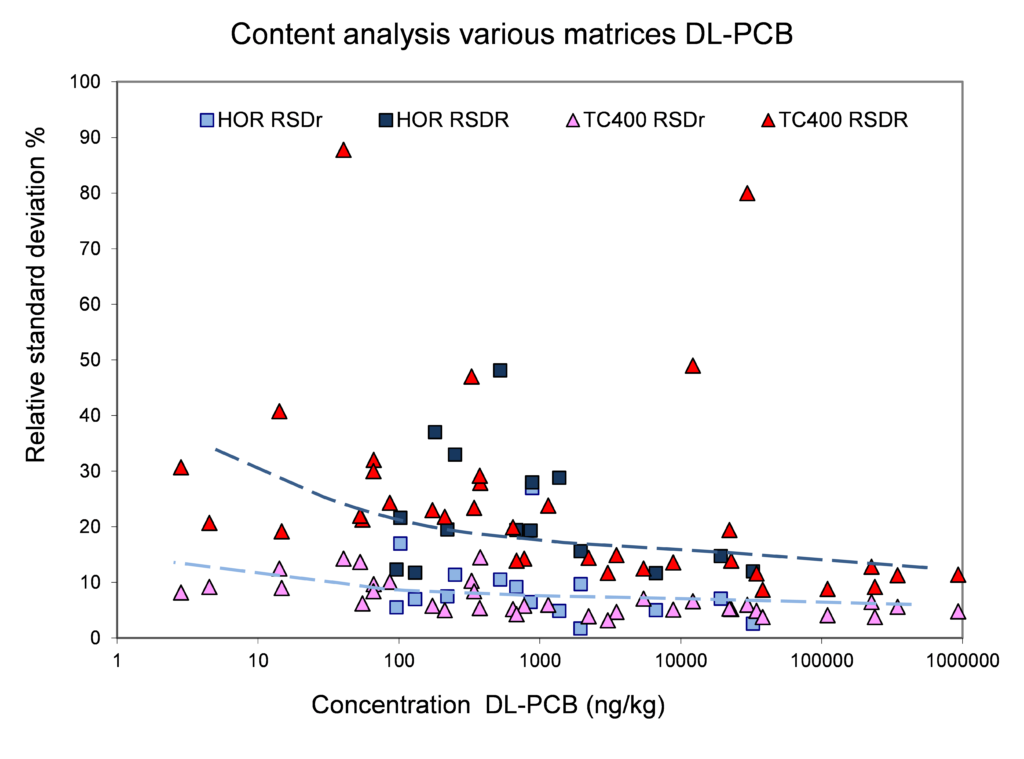
Figure 3. Relative repeatability and reproducibility standard deviations for validation studies for DL-PCB (dioxin like
polychlorobiphenyls) content in soil, sludge and biowaste.

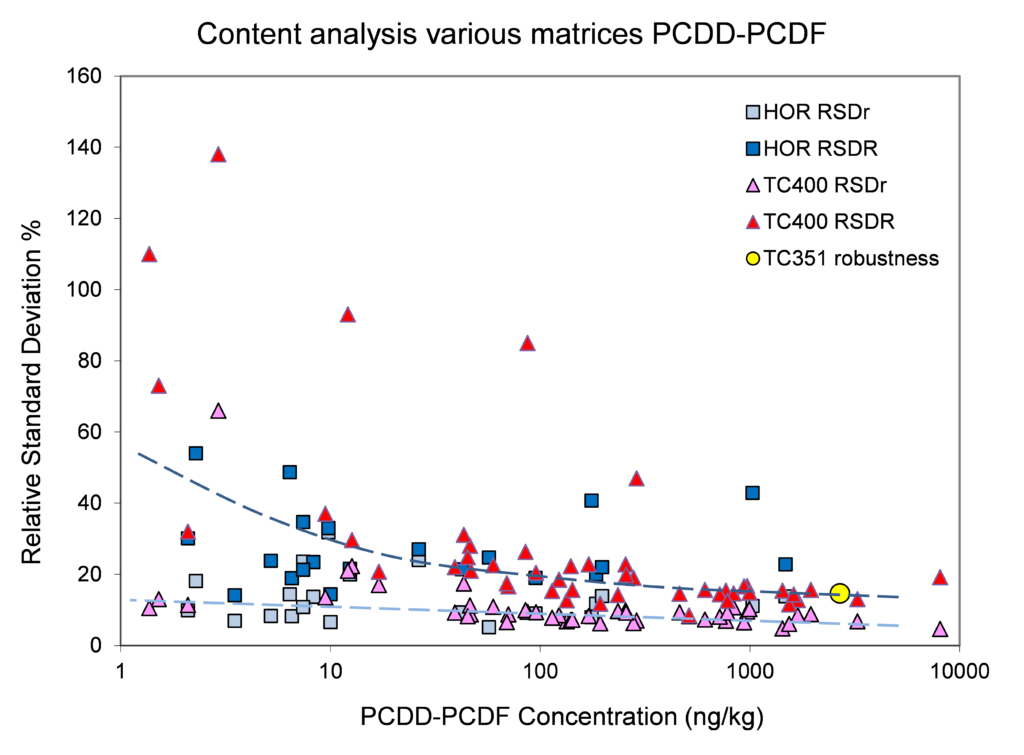
Figure 4. Relative repeatability and reproducibility standard deviations for validation studies for PCDD-PCDF (dibenzofurans and polychlorinated dibenzo-p-dioxins) content in soil, sludge and biowaste.

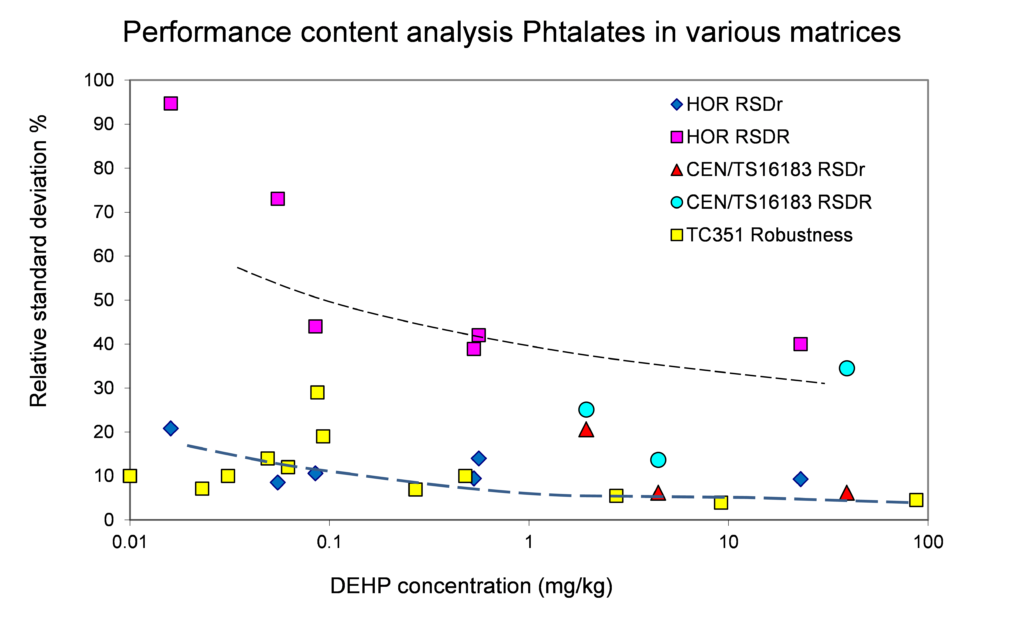
Figure 5. Relative repeatability and reproducibility standard deviations for validation studies of the content of phtalates (DMP, DBP, DEHP) in soil, sludge and biowaste (Project Horizontal – abbreviation HOR and BAM study using CEN/TS 16183) and construction products (sealants in TC 351 Robustness) using CEN/TS 16183.

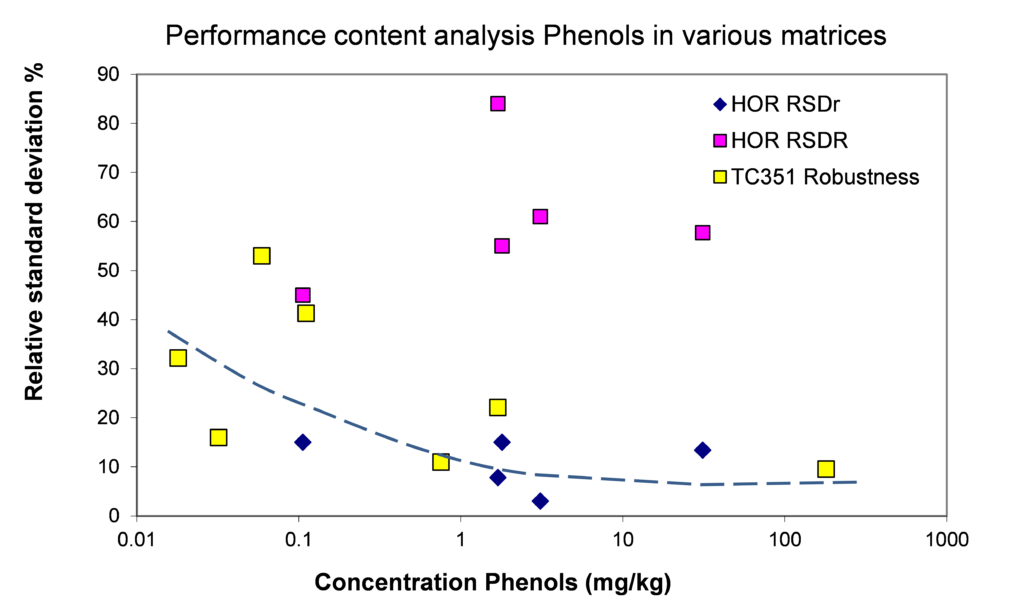
Figure 6. Relative repeatability and reproducibility standard deviations for validation studies of the content of different phenols (phenol, nonylphenol NP, nonylphenol monoethoxylate and diethoxylate, bisphenol A, chlorophenols) in soil, sludge and biowaste (Project Horizontal – abbreviation HOR) and construction products (render and waterproofing sheets in TC 351 Robustness) using CEN/TS 16182.

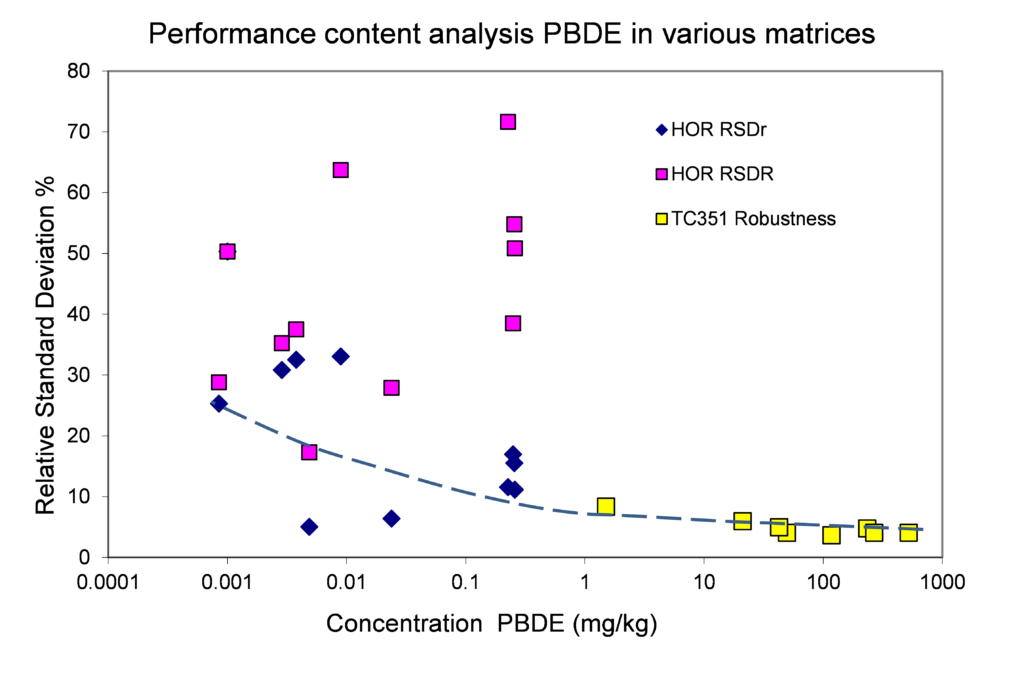
Figure 7. Relative repeatability and reproducibility standard deviations for validation studies of the content of polybrominated diphenyl ethers (PBDE) in soil, sludge and biowaste (Project Horizontal – abbreviation HOR) and construction products (polyethylene reference in TC 351 Robustness) using EN ISO 22032.
Observations:
- Relationship between concentration to be measured and relative standard deviation cannot be ignored, this information complements the tabulated data.
- As concentrations start to approach LOQ or LOD the relative standard deviation increases, this does not invalidate a method.
- In any validation, outliers are observed in concentration ranges where one would assume that analysis should not pose a problem. Sample heterogeneity in spite of appropriate sample homogenization can occur. Such occurrences of unexpected behaviour should be recorded as information to other end users (hyperlink to material issues under Guidance of test use).
- In the analysis of organic substances, the selection of the sample preparation steps from the various available options (extraction, clean-up) and the selection of the analytical measurement technique may lead to a certain contribution to the variance. The methods indicated here for organic substances have many similarities within a group of substances, hence results from different validation studies across matrices complement each other rather than lead to conflicting observations.
References
- EU project Horizontal validation work
- CEN/TC 400 validation studies BAM (EN 16181 PAH, EN 16167 PCB (transferred to EN 17322) and EN 16190 dioxins, furans and dl-PCB)
- EN 15308
- ISO 18287
- CEN/TC 351 validation study JRC
- Horwitz, R. Albert (2006) The Horwitz ratio (HorRat): A useful index of method performance with respect to precision. Mathematics, Medicine, Journal of AOAC International.