In most cases, comparison with regulatory limit values is done in tabulated form. The outcome of a single test result for one or more substances listed in a regulation are compared with the respective limit values leading to a decision that the result is either above, equal or below the limit. This simple and straightforward.
The problem arises, when in the same production process or testing of a treatment, results sometimes fall above and sometimes below the limit. Then a better understanding what is causing the undesirable fluctuation in test results is called for. This requires carrying out a full characterisation leaching test. The most meaningful in this context is the pH dependence test, as it shows the presence of steep gradients (hyperlink to steep pH gradients) and consequently larger fluctuations in such a critical pH range and allows geochemical modelling to identify release controlling phases, that may either help to understand why and possibly provide a cure.
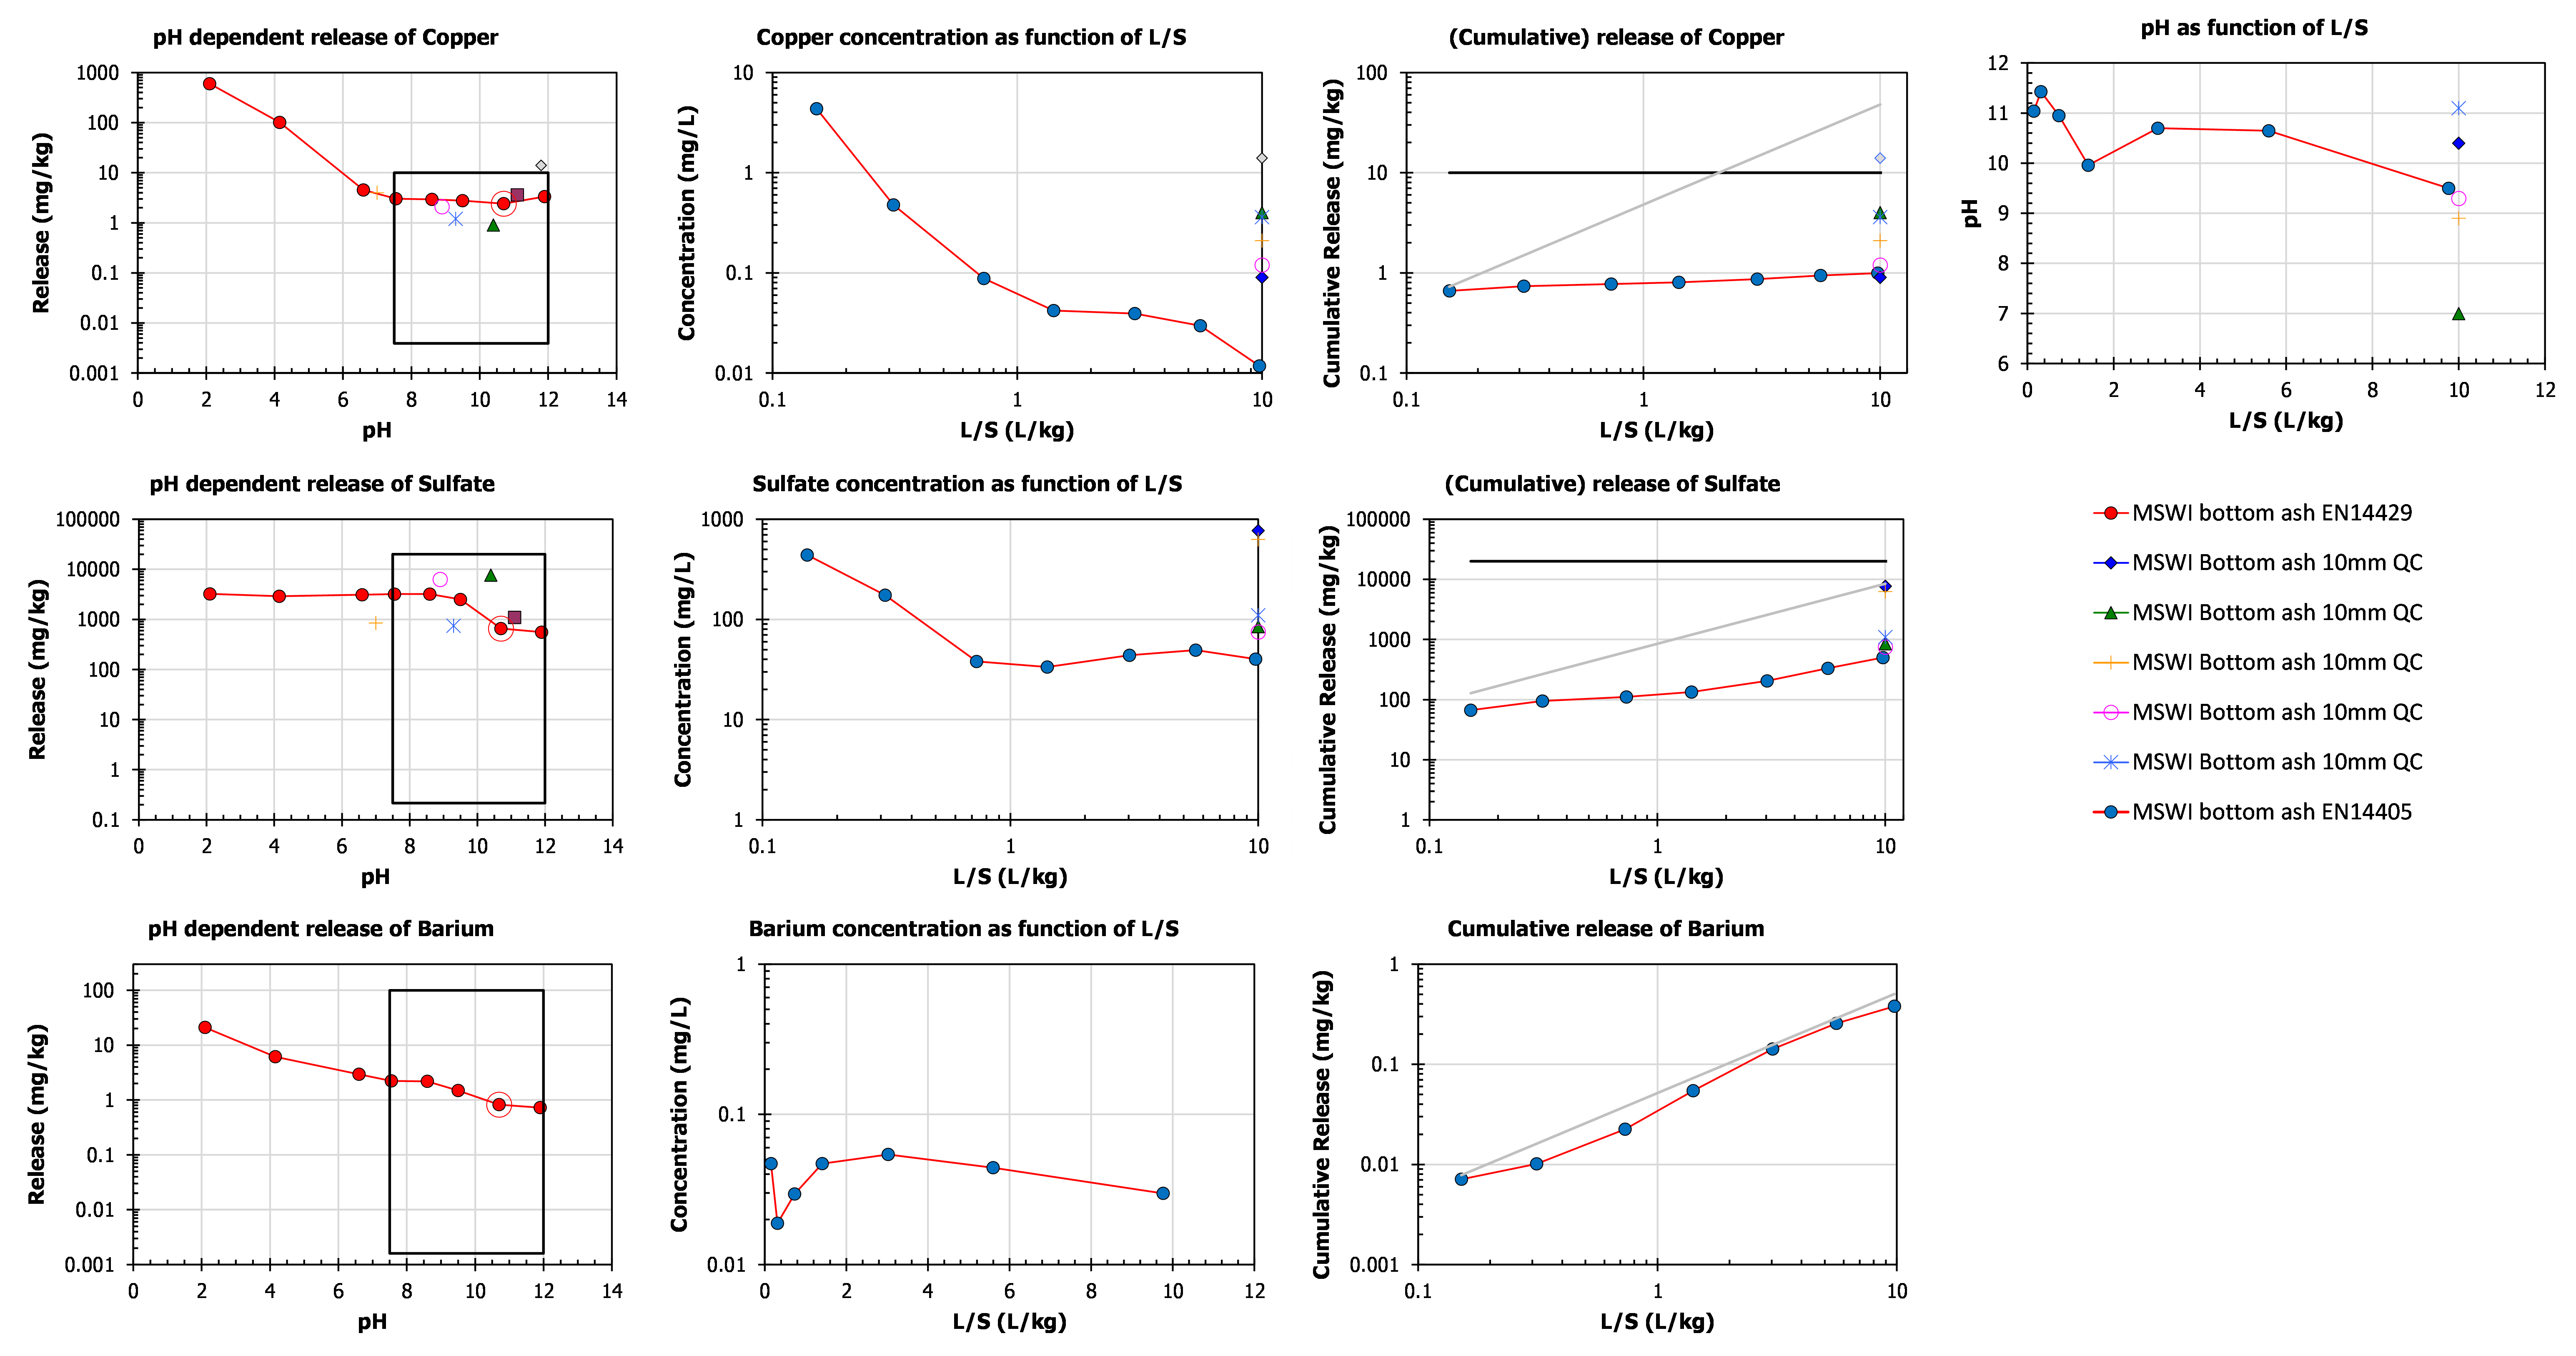
In the graphs below 3 substances (Cu, SO4, Ba) with different release behaviour are illustrated (MSWI bottom ash) with associated regulatory criteria and compliance test data (EN 12457-2).
Copper
In the left graph the pH dependence data are shown with a relatively flat release as function of pH for Cu in the pH domain 7 -12. The Cu leaching in the percolation test shows a steady decrease as a function of L/S, which results in a flat release curve when results are expressed as cumulative release up to a given L/S value. Thus, Cu is a typical example of column wash-out behaviour. From geochemical studies it is caused by the complexation of Cu with dissolved organic matter (Cu-DOC). The solid black line in the release curve corresponds with the regulatory limit value for application of MSWI bottom ash a road base material under an isolation cover (Dutch soil Quality Decree). The box in the pH dependence graph is formed by vertical boundaries set by the pH range expected during the service life of MSWI bottom ash in an application, as at longer term the material will be fully carbonated bringing the pH down to around 7.5 with pH buffering by calcite (hyperlink to MSWI bottom ash roadbase under C). The upper limit is the regulatory criterion for application with a cover and the lower limit corresponds with the detection limit of the analytical method.
Sulphate
The pH dependence for SO4 shows a solubility-controlled decrease in leaching from pH > 10. From geochemical modelling work, it is known that that is related to ettringite solubility in this type of alkaline material (red circle around a red dot shows the own pH of the material). The leaching as a function of L/S shows an initial raid decrease until L/S=1 and then a constant concentration as a function of L/S. The first part of the curve implies washout of a soluble sulphate fraction. The second part of the curve denotes solubility control, likely by gypsum. The slope in the second part of the curve approaches 1 in the cumulative release – L/S plot indicative of solubility control.
Barium
Barium leaching as a function of pH shows a steady decrease with increasing pH resulting from solubility control. As can be seen by the Ba release as function of L/S the concentration follows the pH per fraction as shown in the top right graph. The close match between cumulative release of Ba as a function of L/S with the grey line, which has a slope of 1 depicting full solubility control, is a clear indication that Ba release fully solubility controlled over the entire pH domain.
The individual data points obtained by EN 12457-2 reflect variations in test performance, chemical analysis, combustion process and probably most important variations in the input Municipal solid waste. Although not obvious from single data points scattered around the pH dependence test, a comparison of full pH dependence test has shown quite consistent leaching behaviour dictated by the mass-burn combustion process. This then implies that the vertical lines in the pH dependence test indicating the expected pH range for the material under consideration will reflect the maximum leaching of the service-life of the material, as the cumulative release at L/S=10 in the percolation test, on which the regulation is based, is a comparable end-point as obtained in the pH dependence test at L/S=10.
Return to Homepage
