Performance characteristics

Validation is a crucial step in the course of the elaboration and standardisation of environmental tests methods and is aimed at providing information on the reliability of the tests results. This enables the quantification of the uncertainties in the tests results of the procedure.

Validation of a method is performed in two steps:

  1. robustness testing
  2. interlaboratory testing (determination of performance characteristics)

Robustness testing is done based on the standard draft to check how far the test conditions can be varied without influencing the test results. Subsequently, the standard draft is optimised if necessary.

The performance characteristics are calculated from the data set of interlaboratory trials and comprise the repeatability (standard deviation within the participating laboratories) and reproducibility (standard deviation between the participating laboratories) using for example ISO 5725-2 and ISO 5725-5.

The performance of leaching tests is in addition dependent on the tested material and on the substances measured in the eluates.

Several validation studies were carried out for determination of the robustness, repeatability and reproducibility of leaching procedures

Sub-sampling

Comparison of elemental composition and leaching after sub-sampling

In the framework of the EN 12457 validation sub-sampling aspects were evaluated as part of uncertainties about preferred sub-sampling procedures and possible heterogeneities in materials to be analysed. Below results for MSWI bottom ash are discussed. Full details can be found in []. MSWI bottom ash is heterogeneous in composition with respect to Cu, Ni and Pb. Results are also graphically displayed.


Material: MSWI bottom ash; Analysis in five-fold after sub-sampling as specified; Underlined: lowest CV; Bold: highest CV.


Significantly higher or significantly lower than overall average: Ba, Cu, Mo, Ni, Pb, Sn, Zn


Besides content analysis, EN 12457 was carried out in sub-samples from the three sub-sampling methods with different particle size ranges. In the table below the leaching results for Cu, Zn and Mo using EN 12457-2 are shown in conjunction with content analysis for these elements. Clearly, standard deviations from leaching are lower than for content analysis. In general, the standard deviations for leaching are larger for the coarse material (40 mm) vs the finer grained materials (10 mm and 4 mm). Note that higher deviations for leaching of Zn in comparison with composition are related to very low leaching concentrations of Zn.

Composition taken from table above; Size fractions 40 mm, 10 mm and 4 mm tested at L/S=10.


Performance data of leaching test methods, content and eluate analysis

Leaching tests, eluate analysis methods and content analysis methods have been validated over the last decades. From various standards and underlying studies performance data have been gathered for inorganic and organic substances with respect to leaching, eluate analysis and content analysis (period 1995 -2019). In tables 1 – 4 performance data are given for inorganic and organic substances on leaching tests, eluate analysis and content analysis.


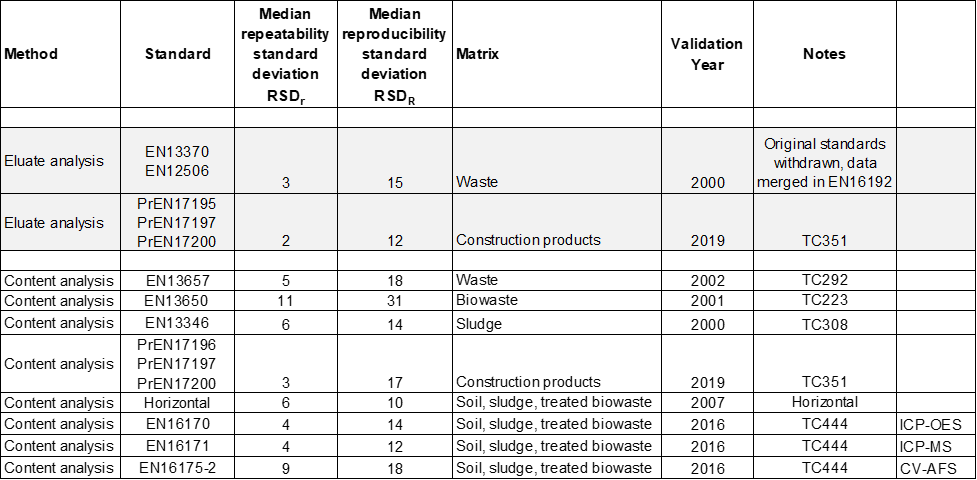
Table 1 – Summary of performance data for leaching tests – inorganic substances


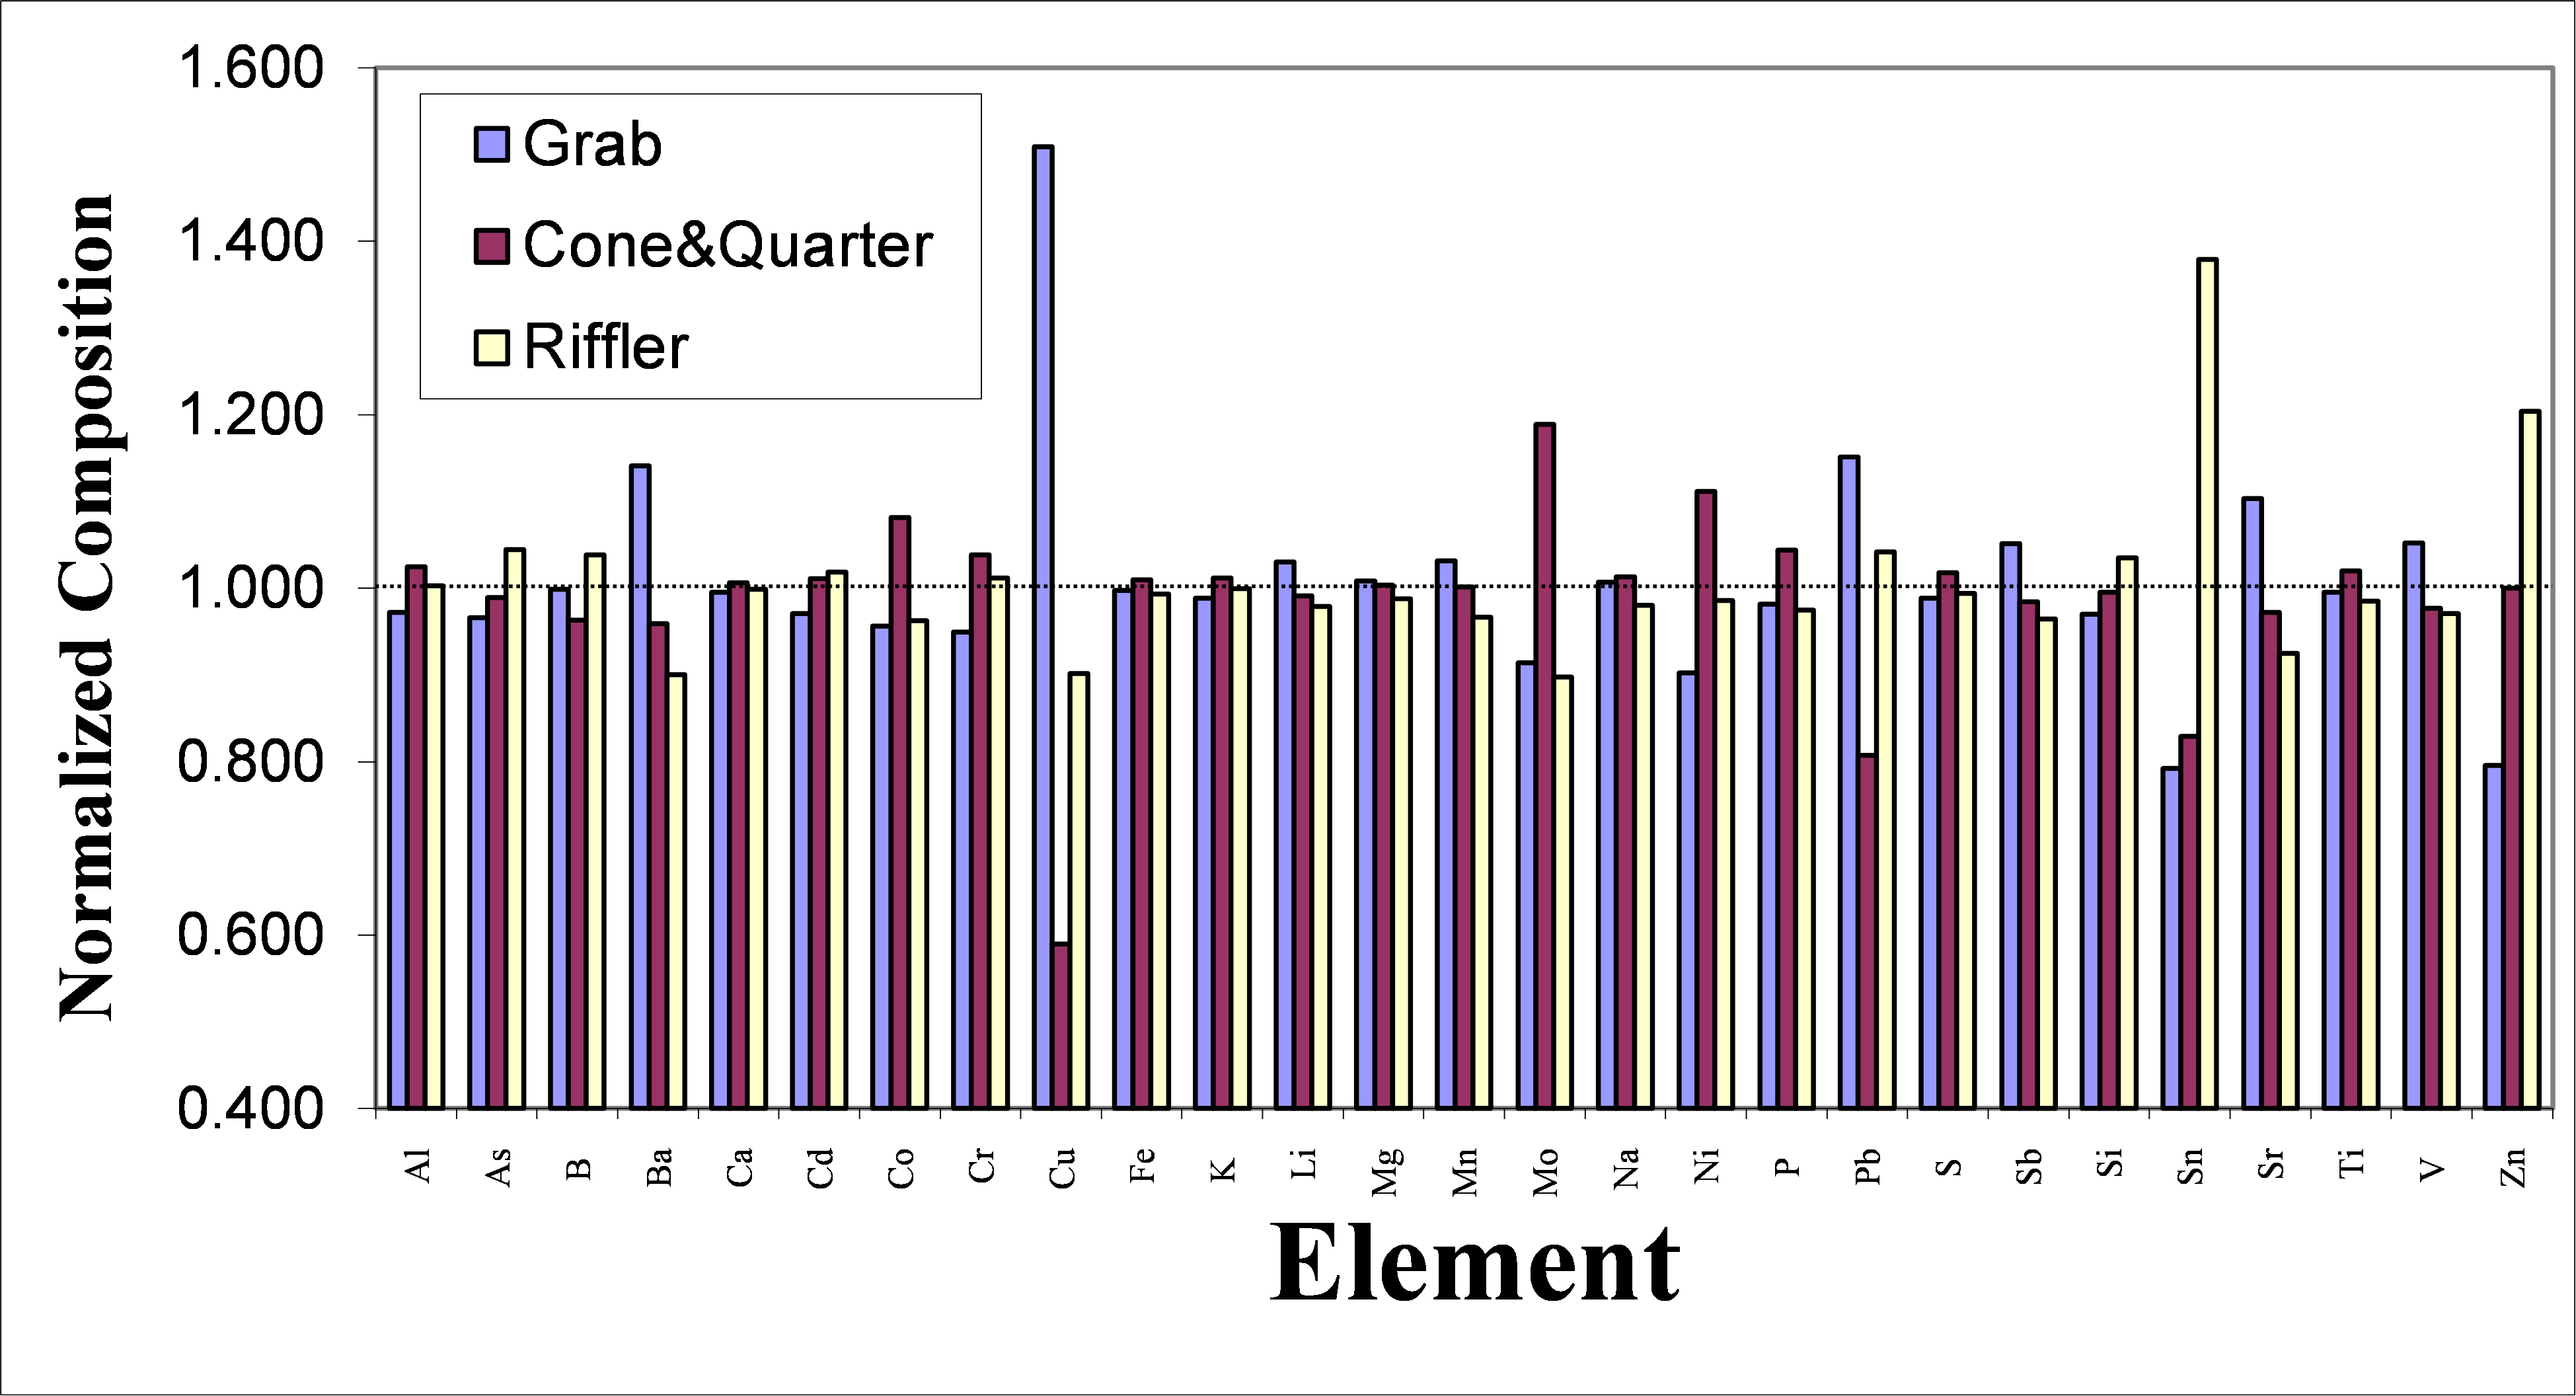
Figure 1. Performance data for leaching of inorganic substances by different methods expressed as RSDR; uncertainty bars given as ± RSDr .


Table 3 – Summary of performance data for content and eluate analysis – inorganic substances

Note to table 3: The number of participating labs varies between 12 and 20.


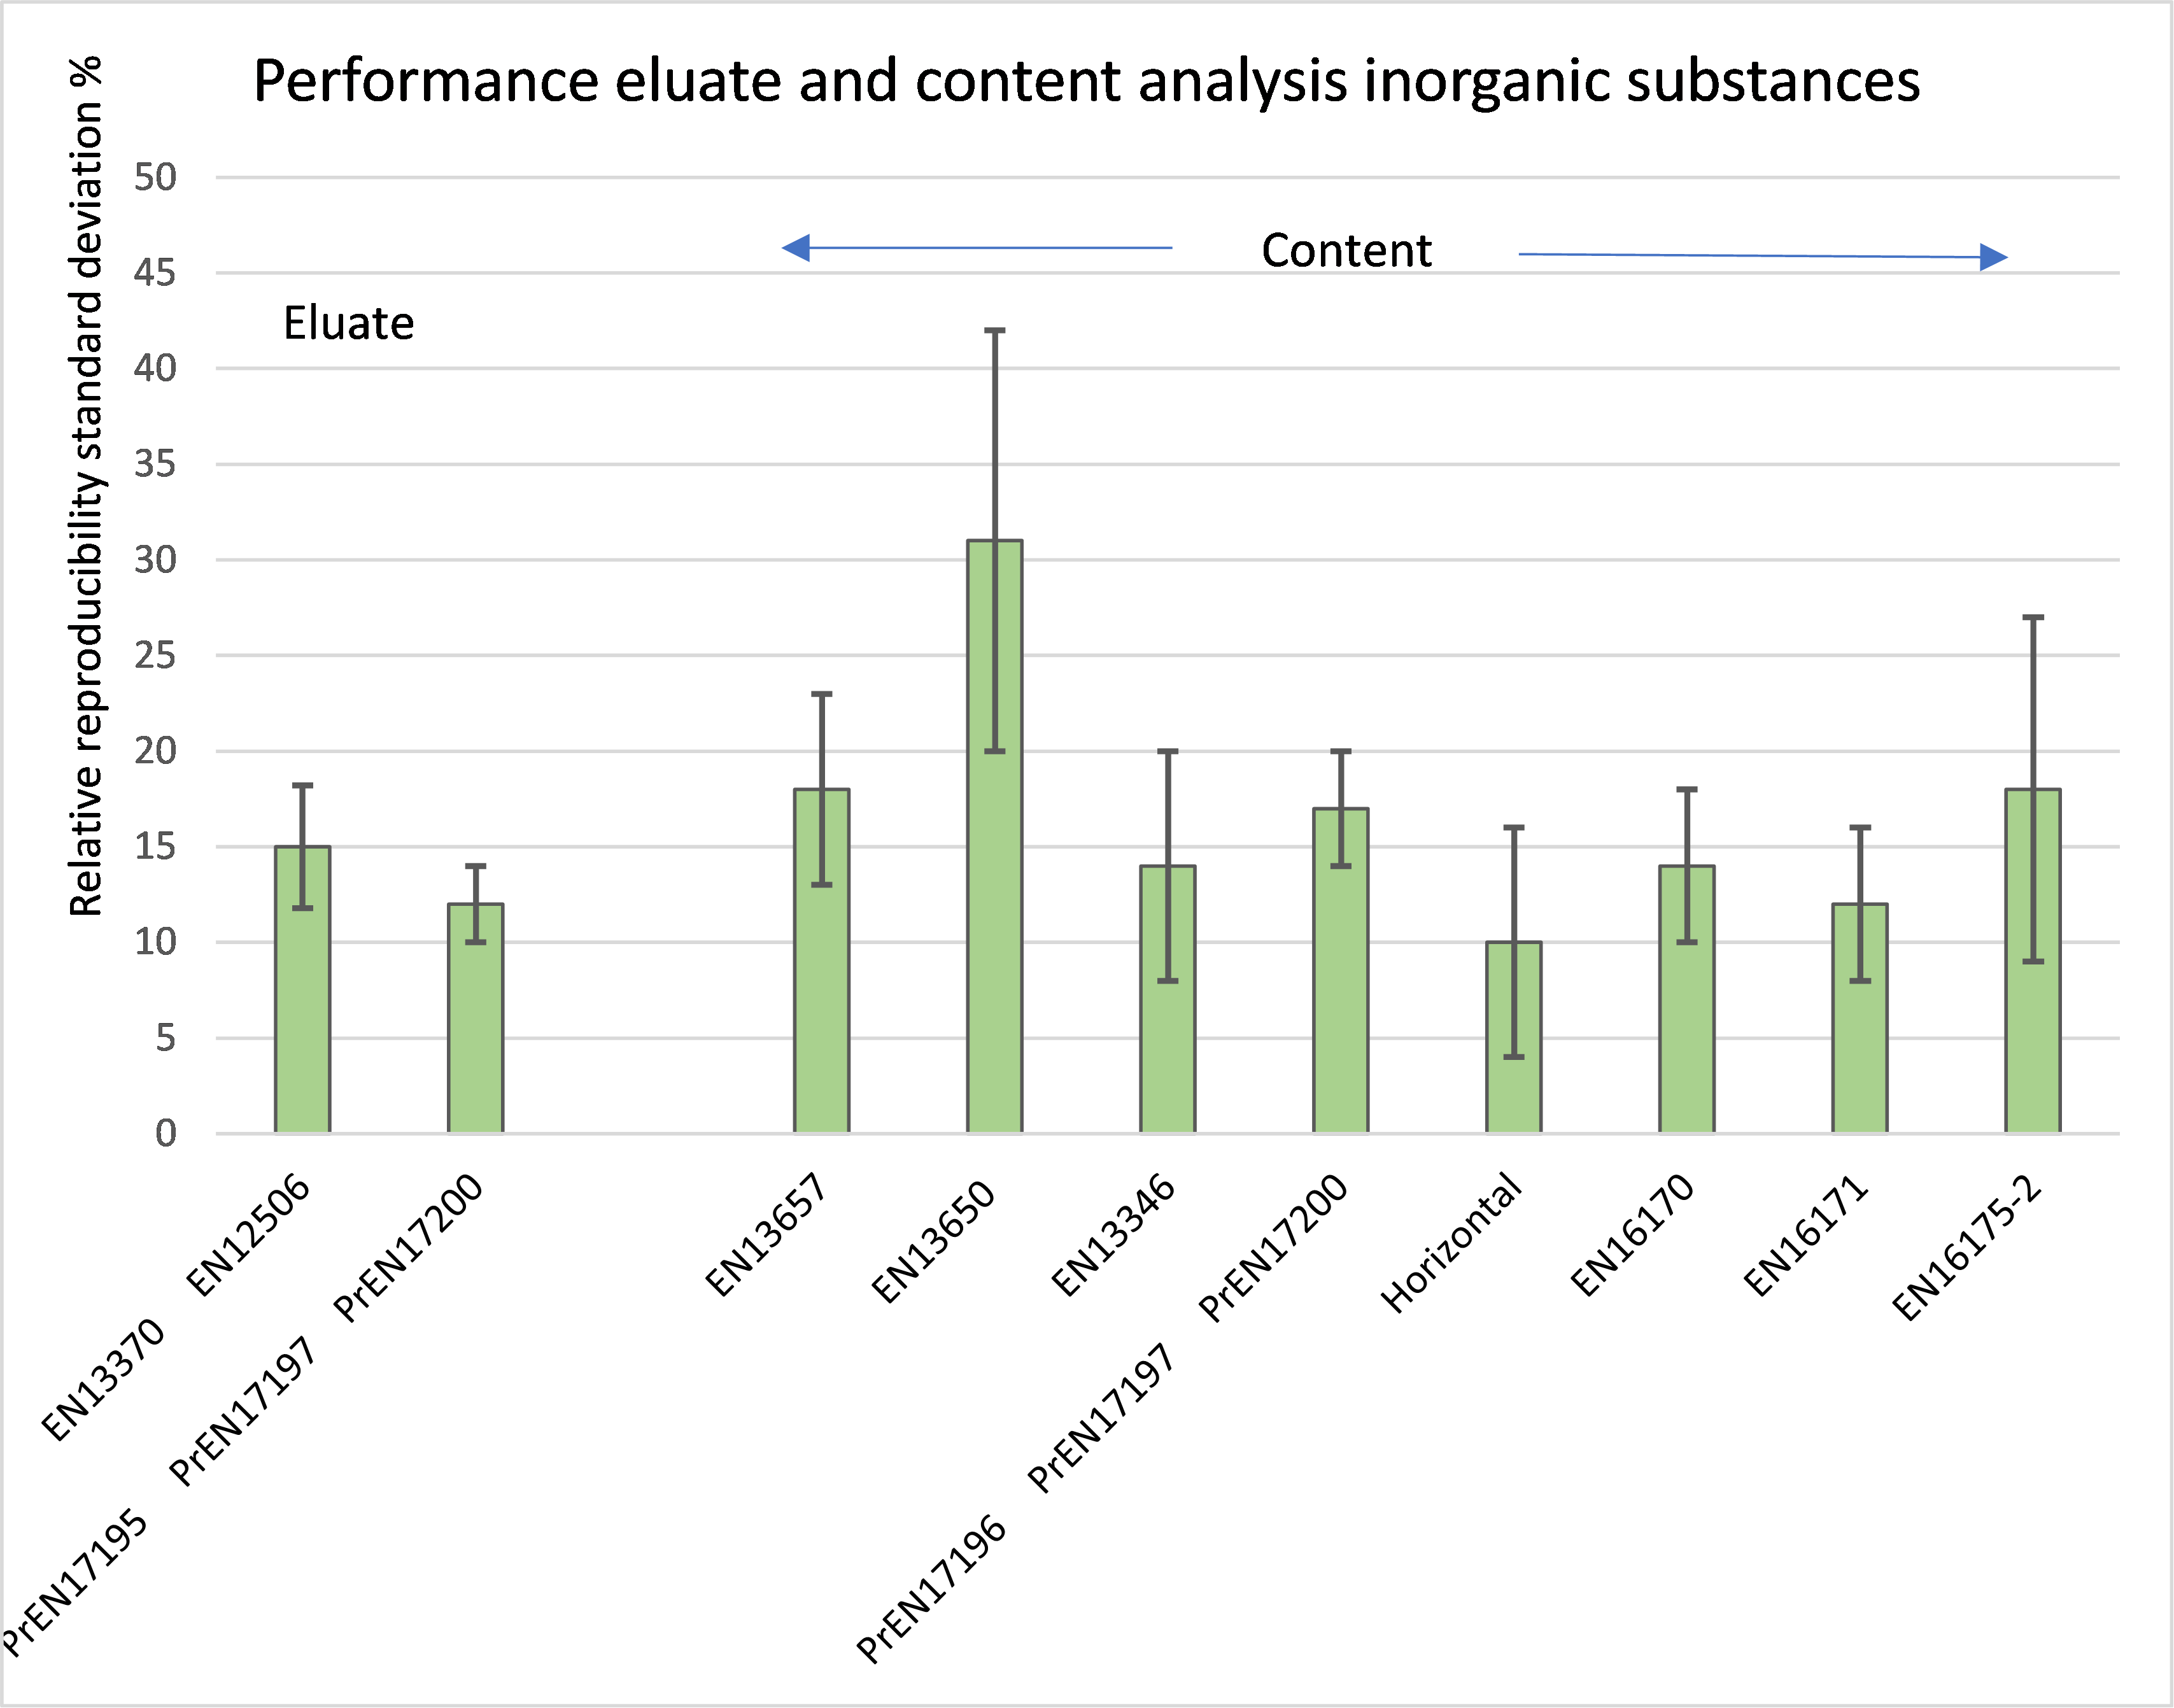
Figure 2. Performance data for content analysis of inorganic substances by different methods expressed as RSDR; uncertainty bars given as ± RSDr .


Table 4 – Summary of performance data for content and eluate analysis – organic substances


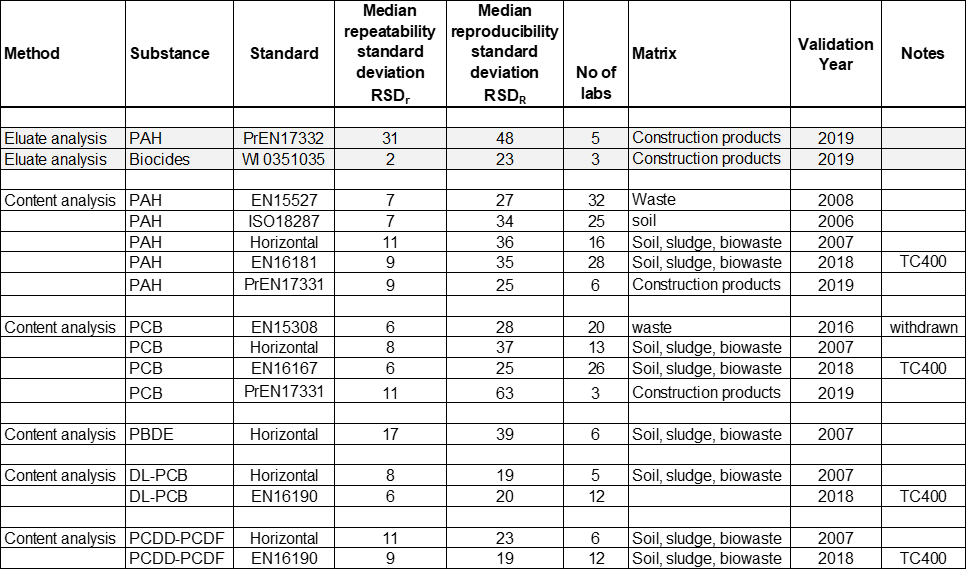
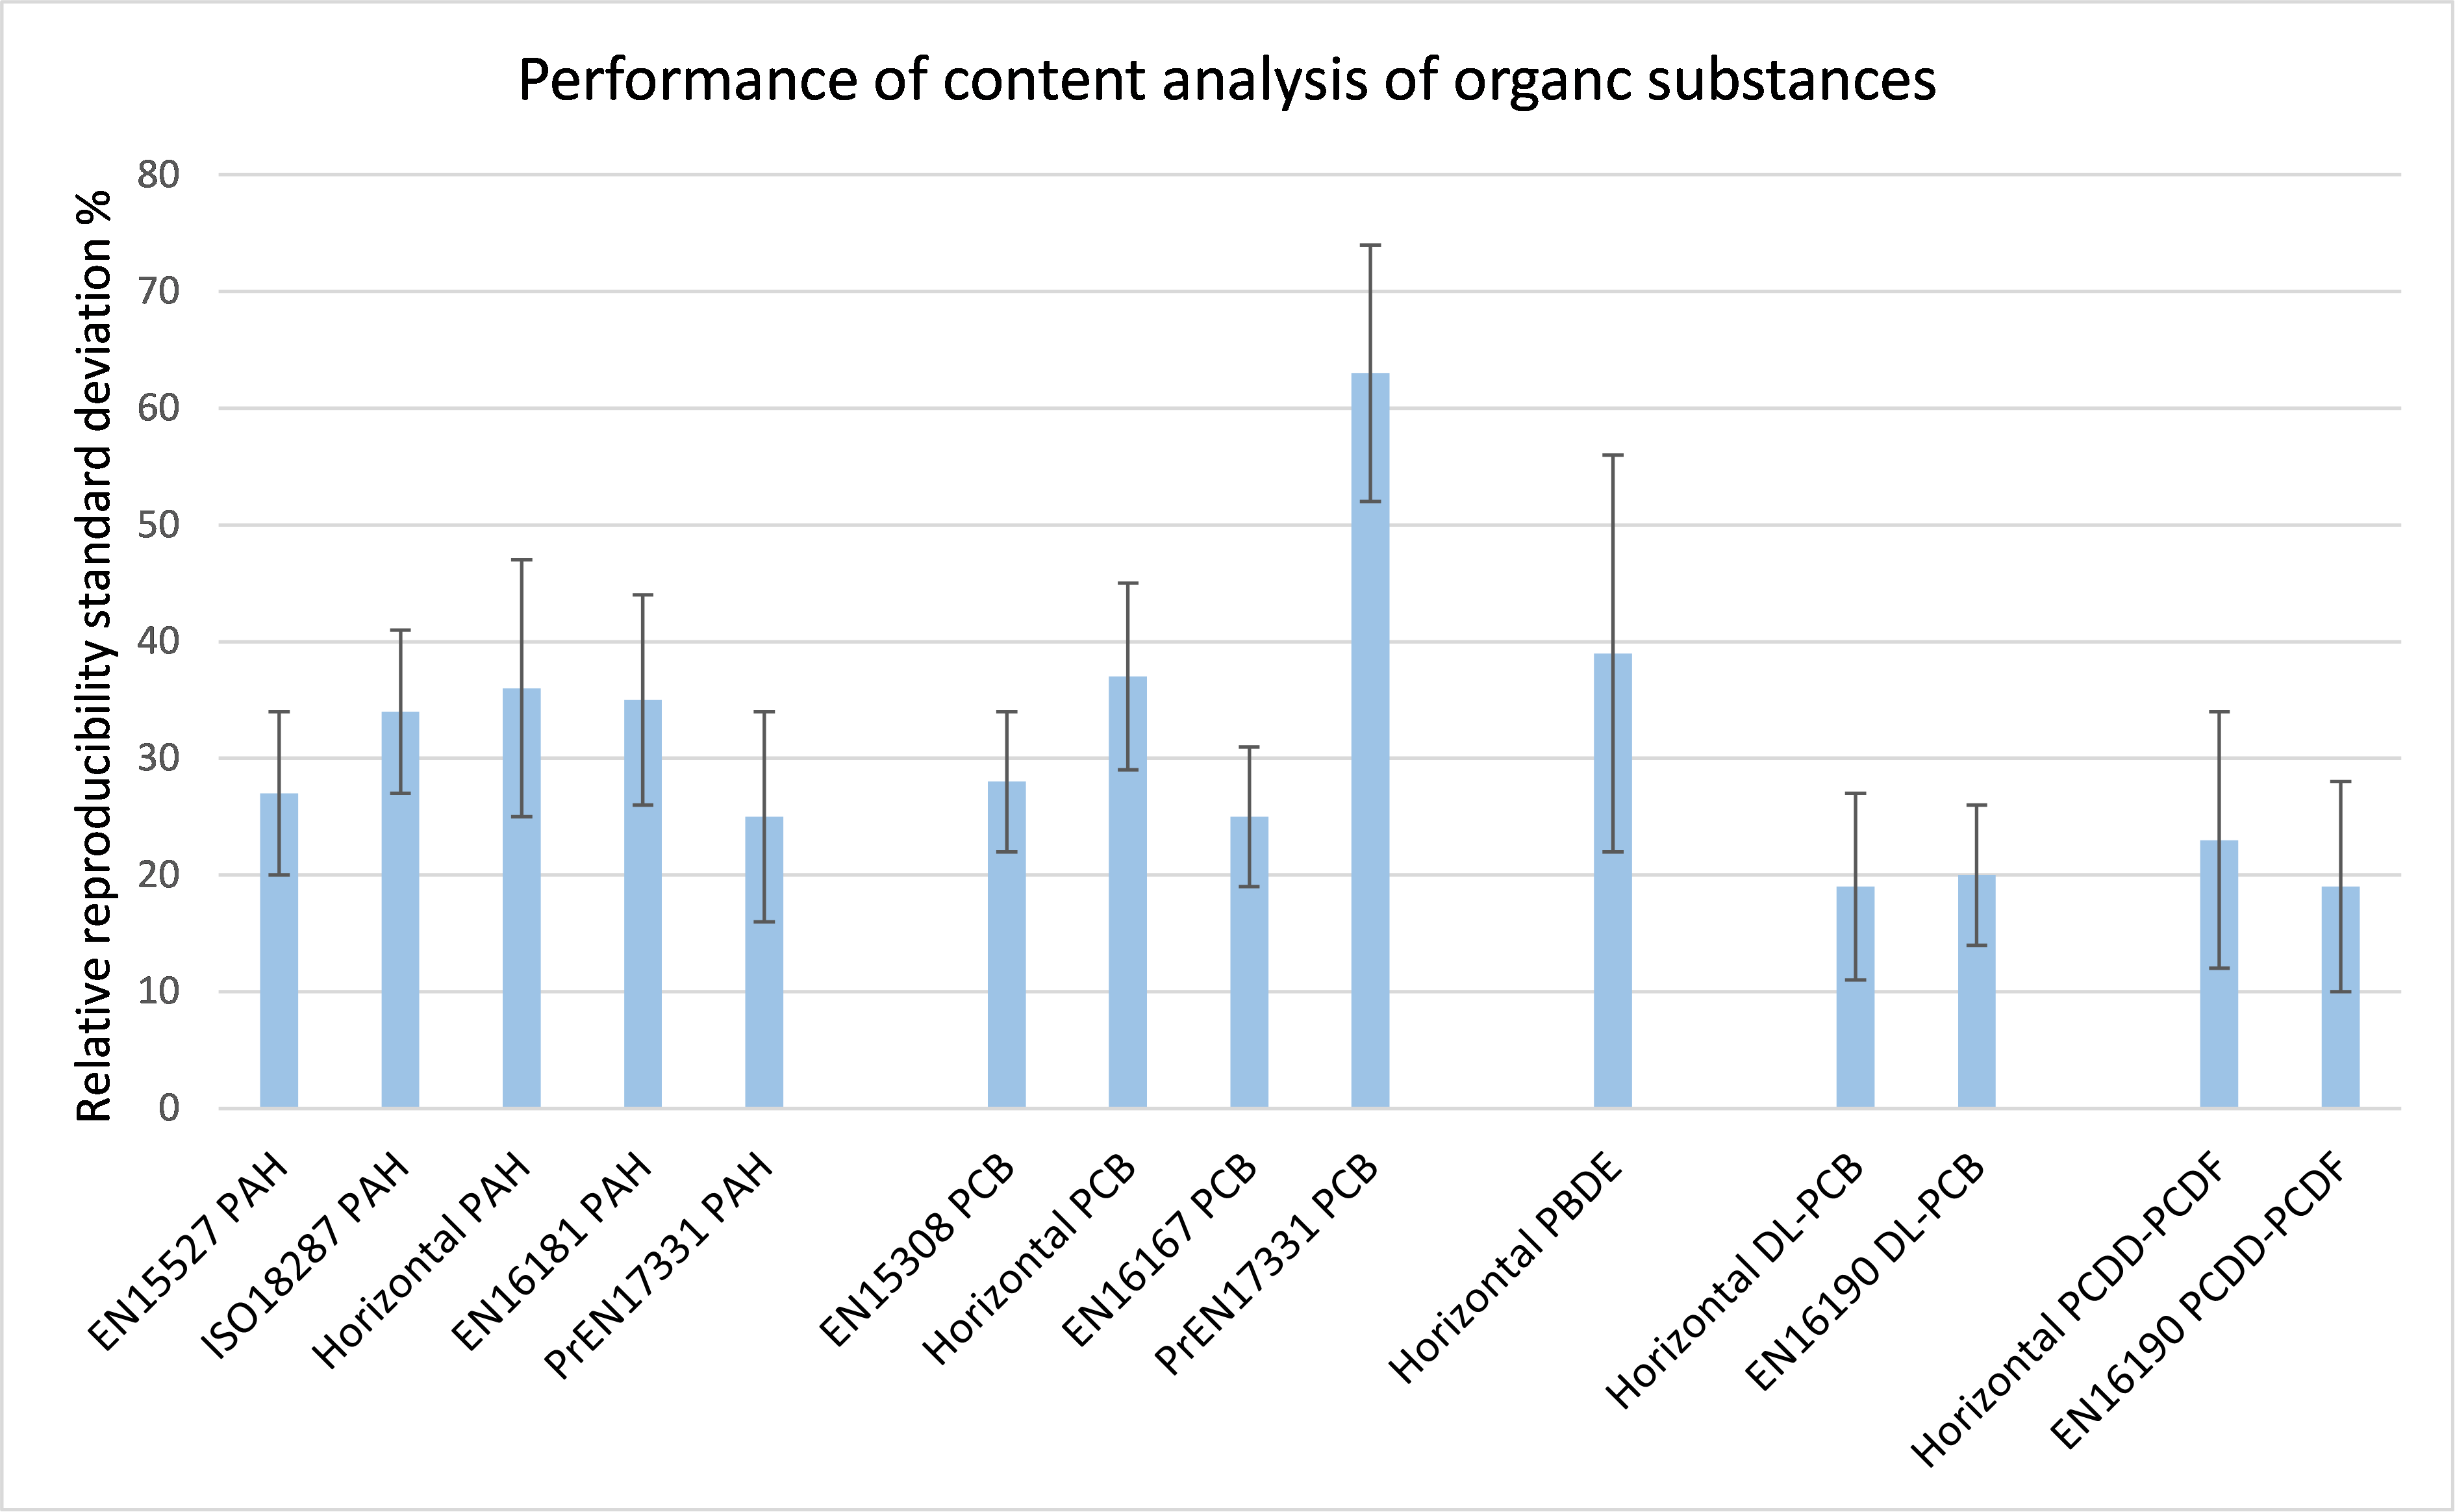
Figure 3. Performance data for content of organic substances by different methods expressed as RSDR; uncertainty bars given as ± RSDr .


The relative reproducibility standard deviation provides a determination of the differences (positive and negative) that can be found (with a 68 % statistical confidence) between a single test result obtained by a laboratory using its own facilities and another test result obtained by another laboratory using its own facilities, both test results being obtained under the following conditions : The tests are performed in accordance with all the requirements of the respective standards and the two laboratory samples are obtained from the same primary field sample and prepared under identical procedures. The relative repeatability standard deviation refers to measurements obtained from the same laboratory, all other conditions being identical. The reproducibility standard deviation and the repeatability standard deviation do not cover sampling but cover all activities carried out on the laboratory sample including its preparation from the primary field sample.

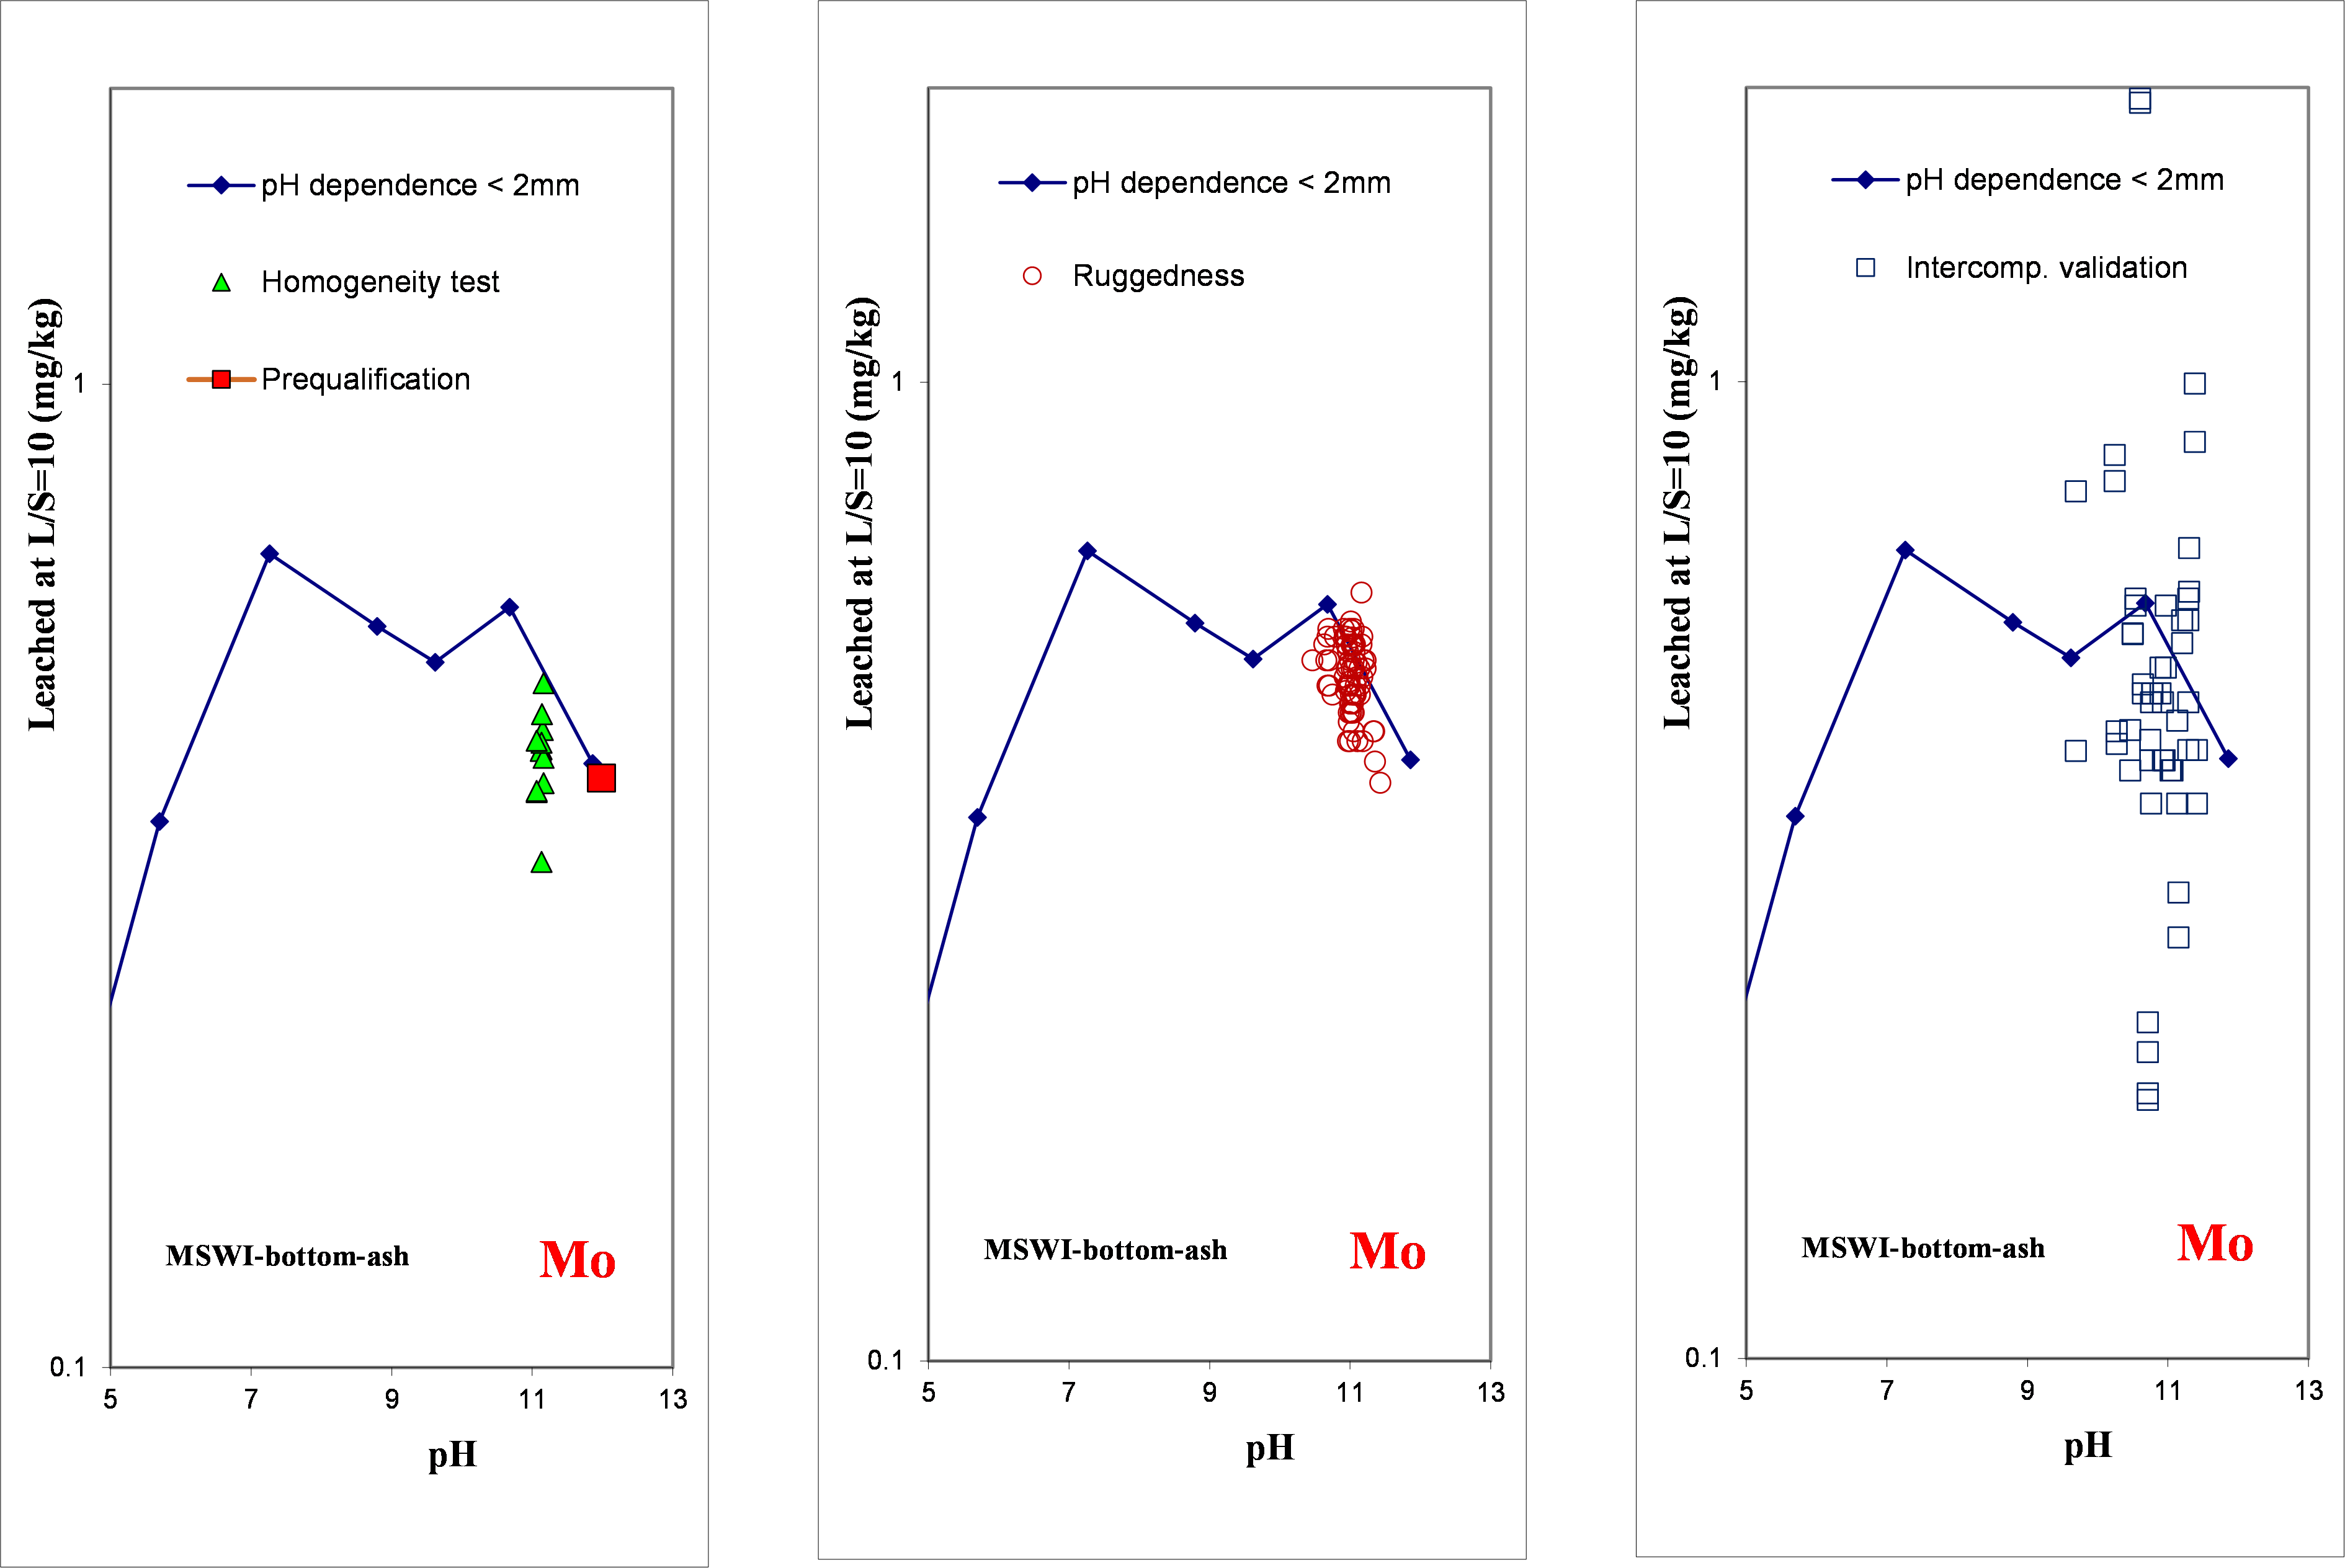
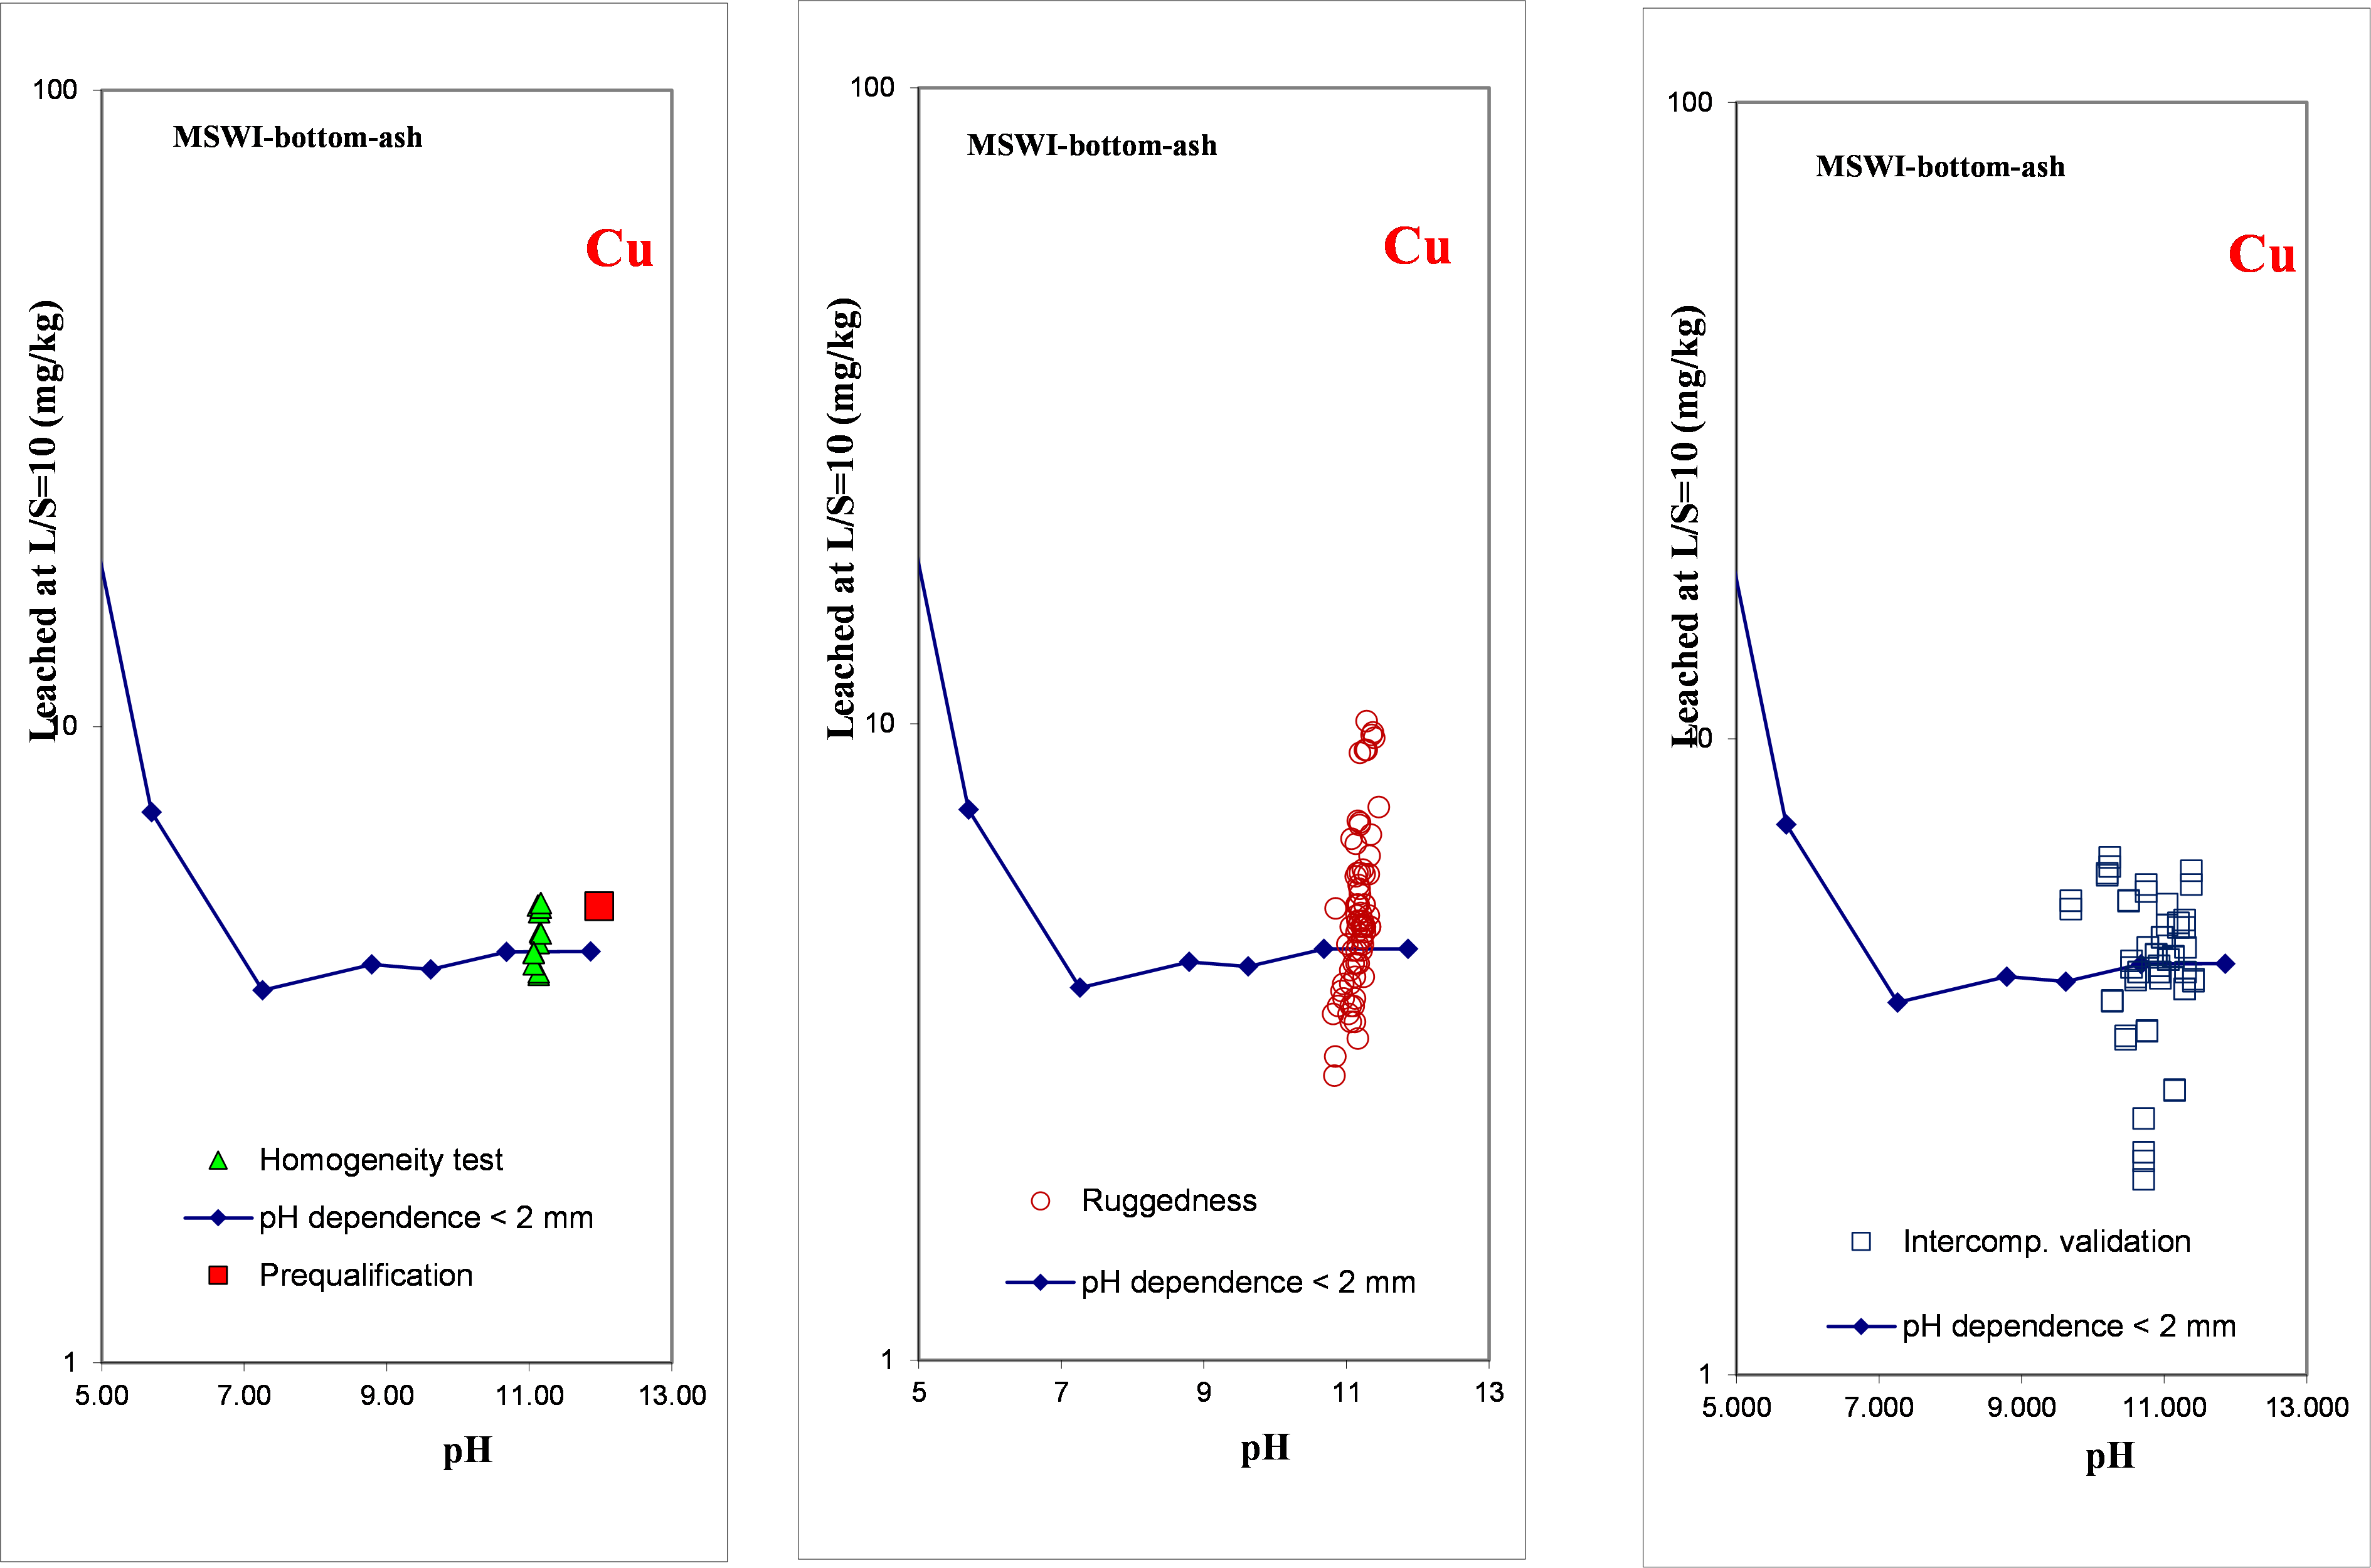
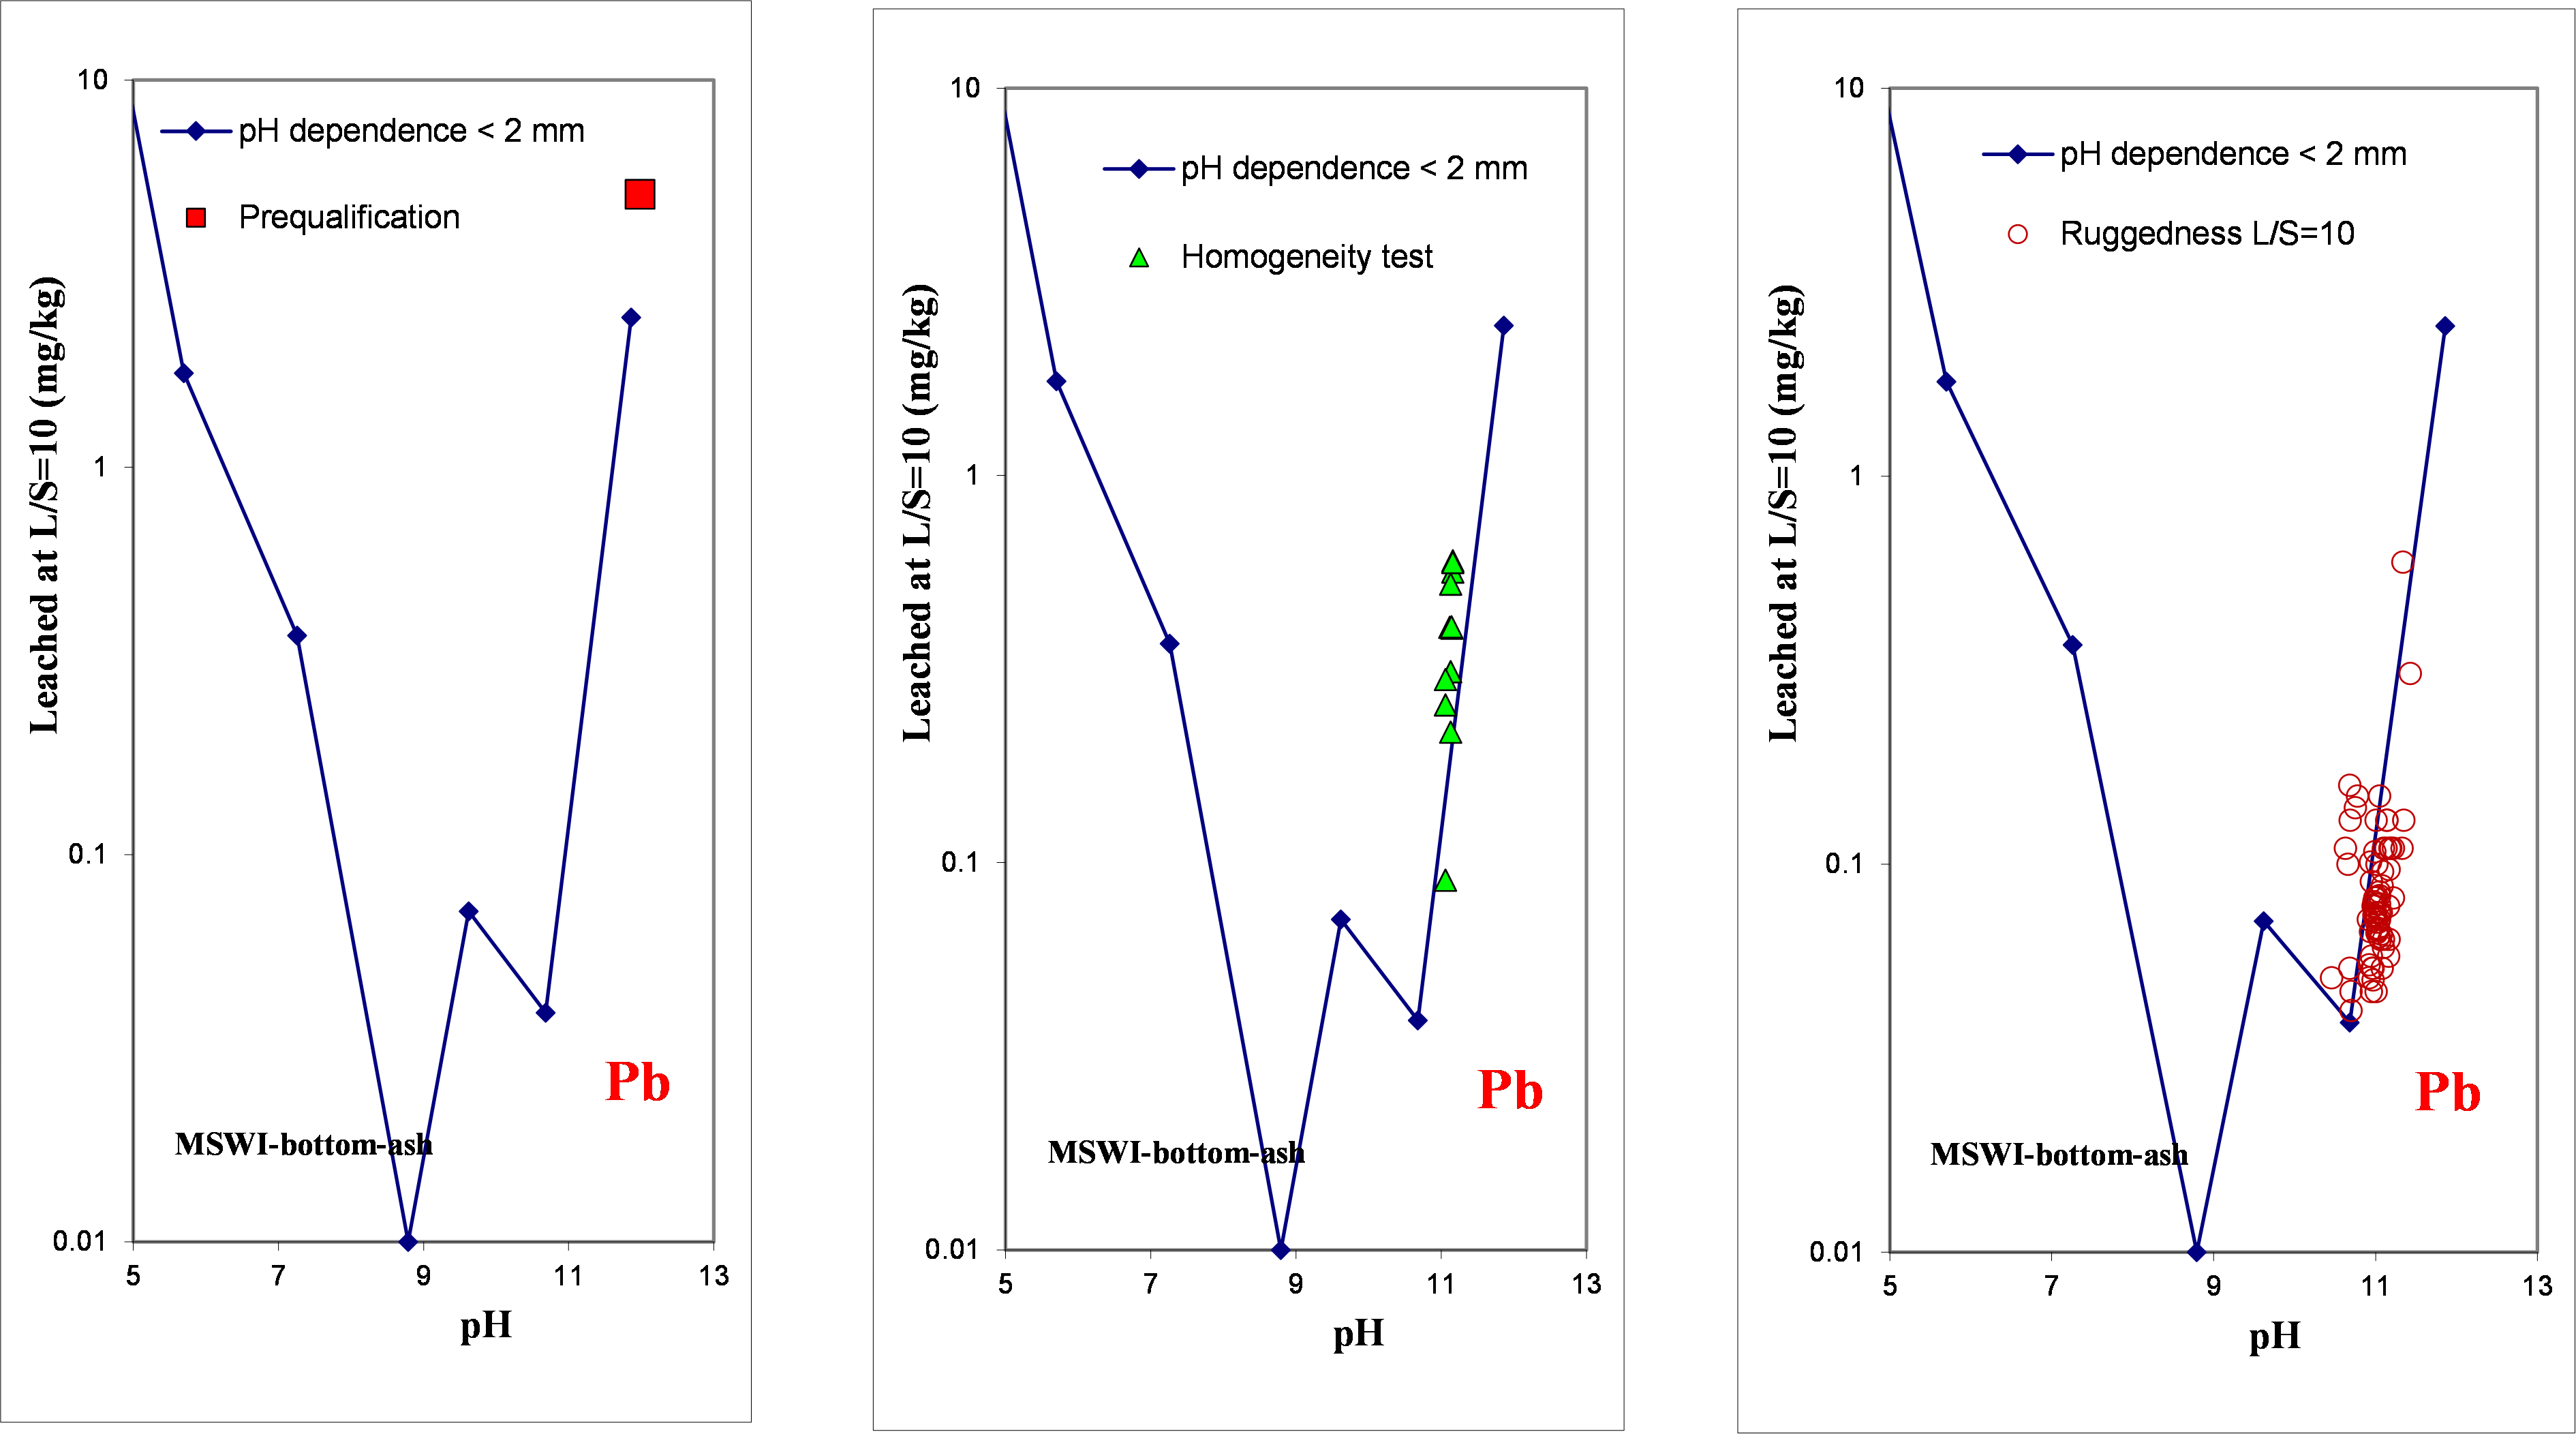
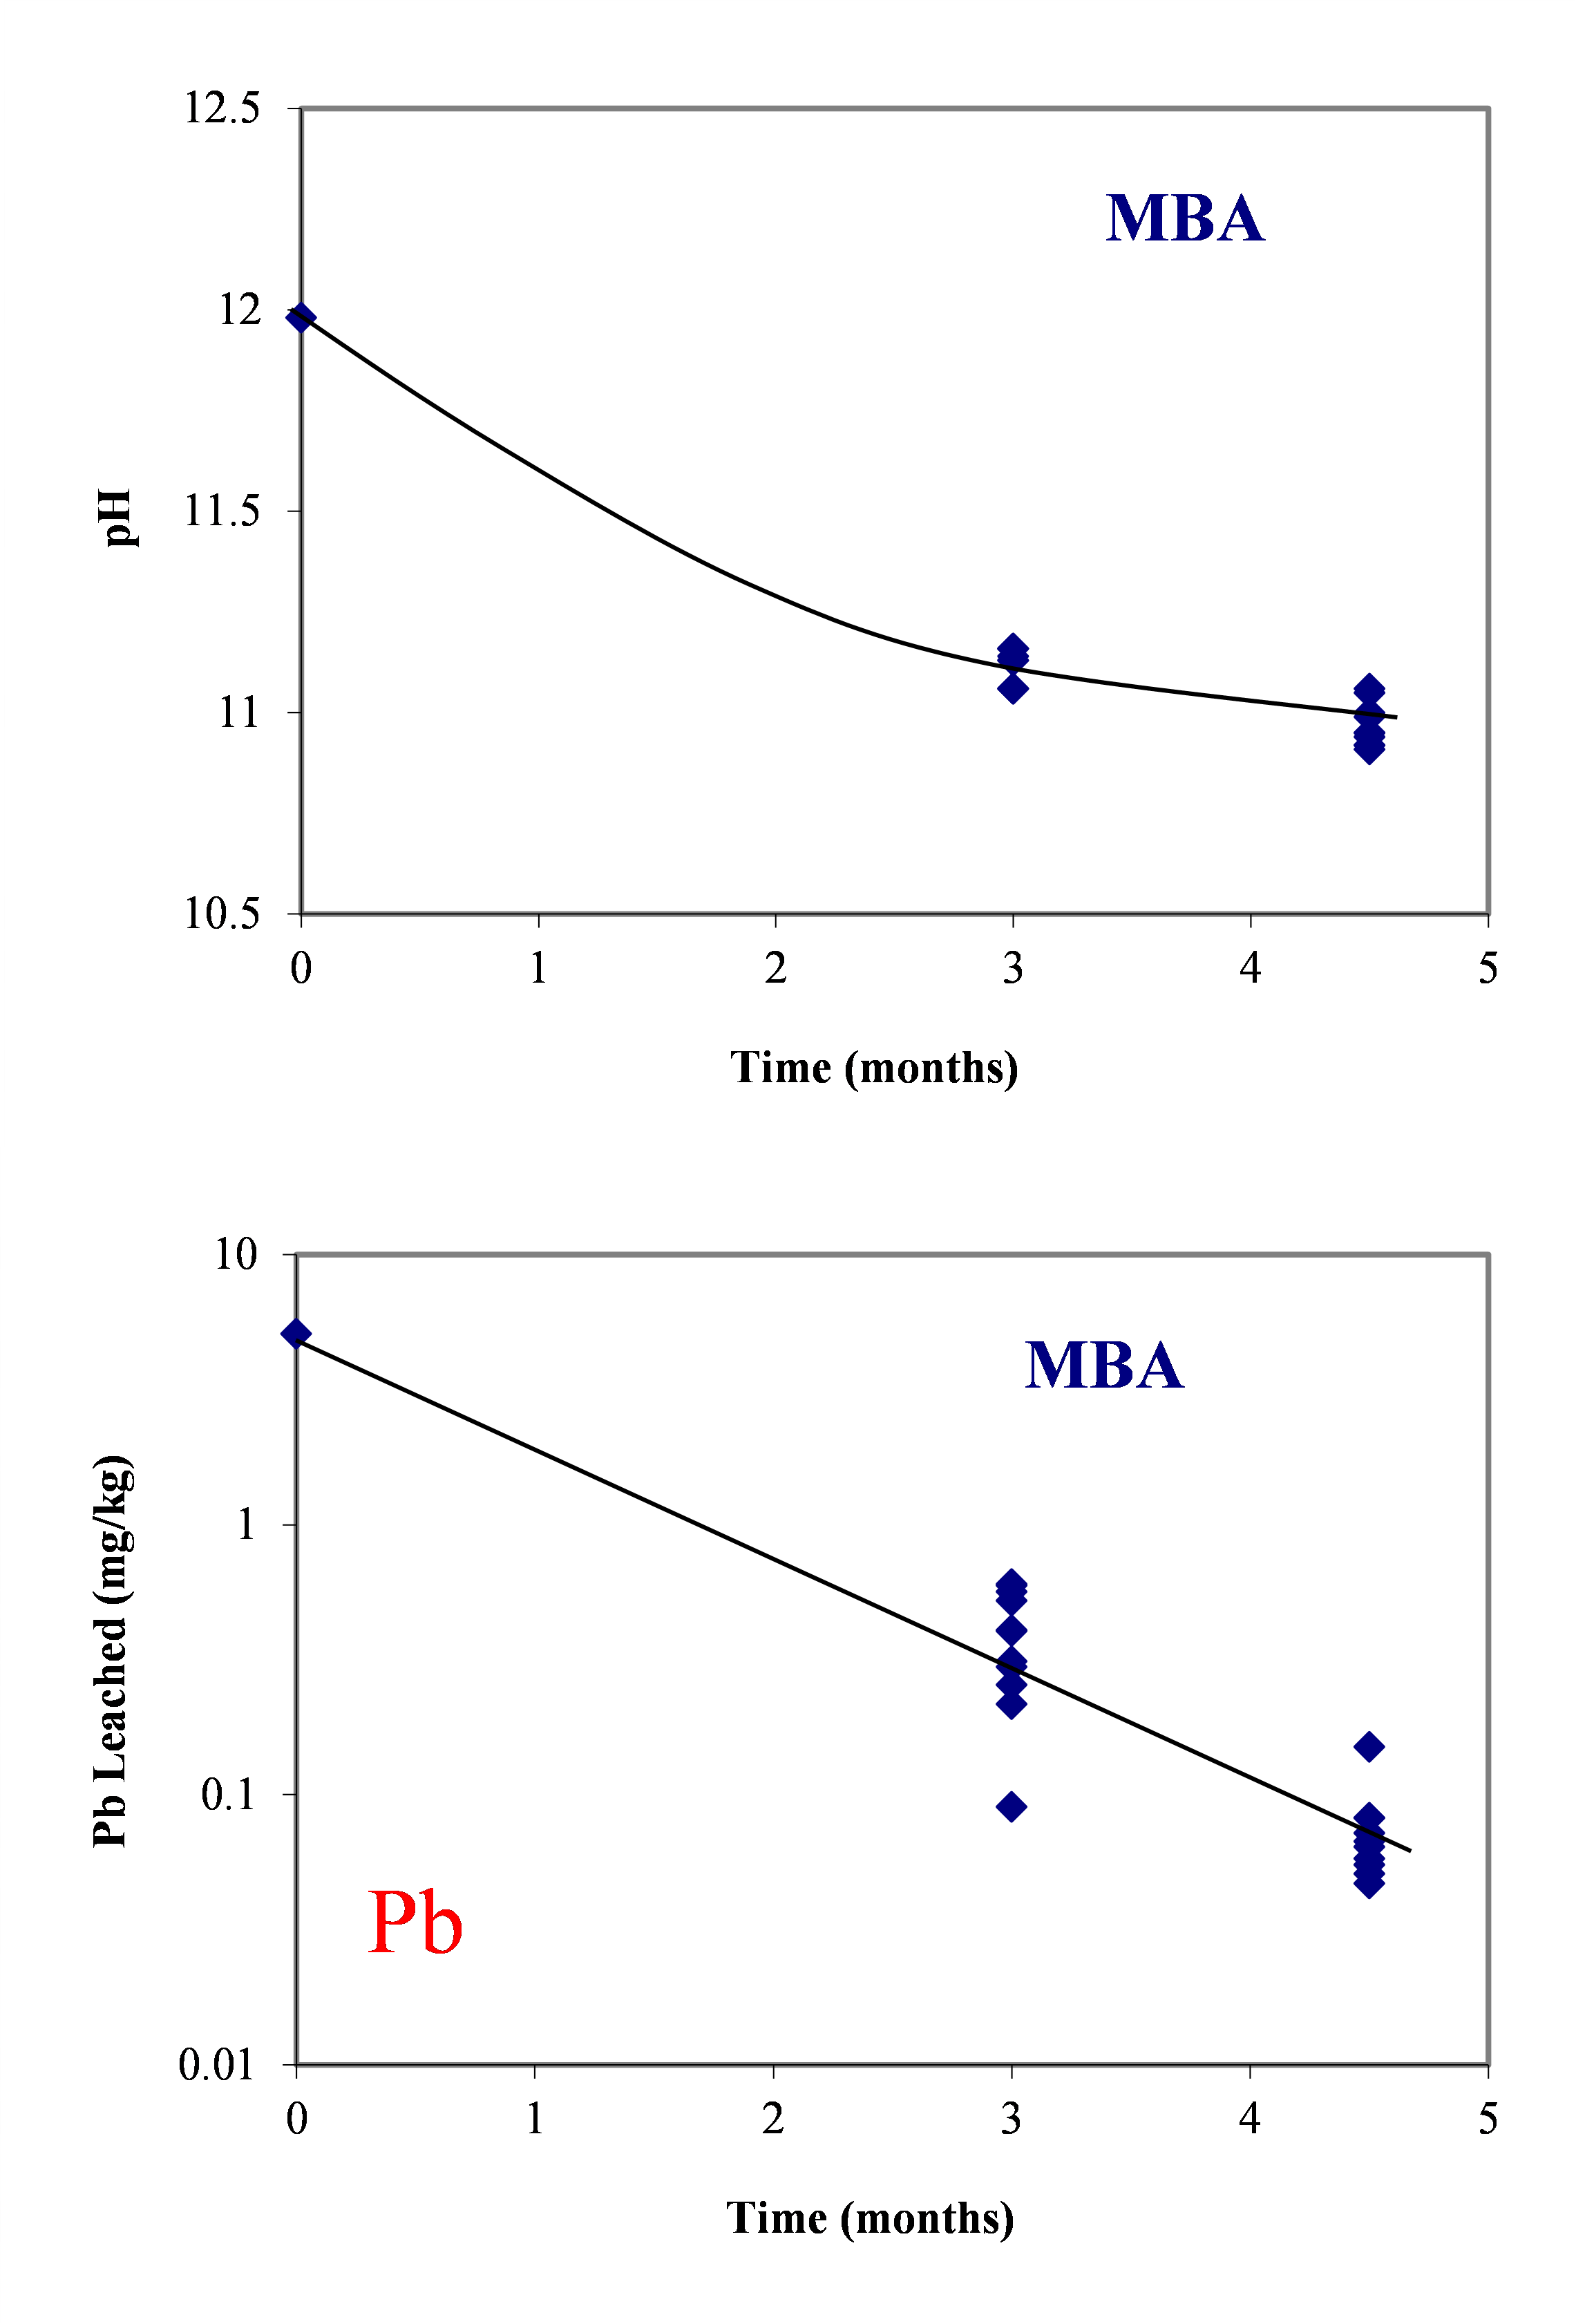
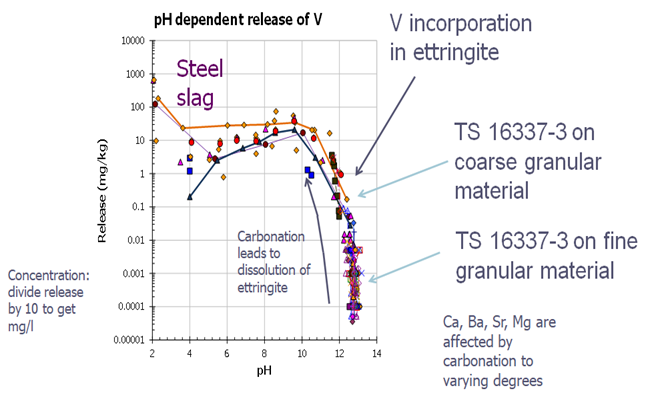
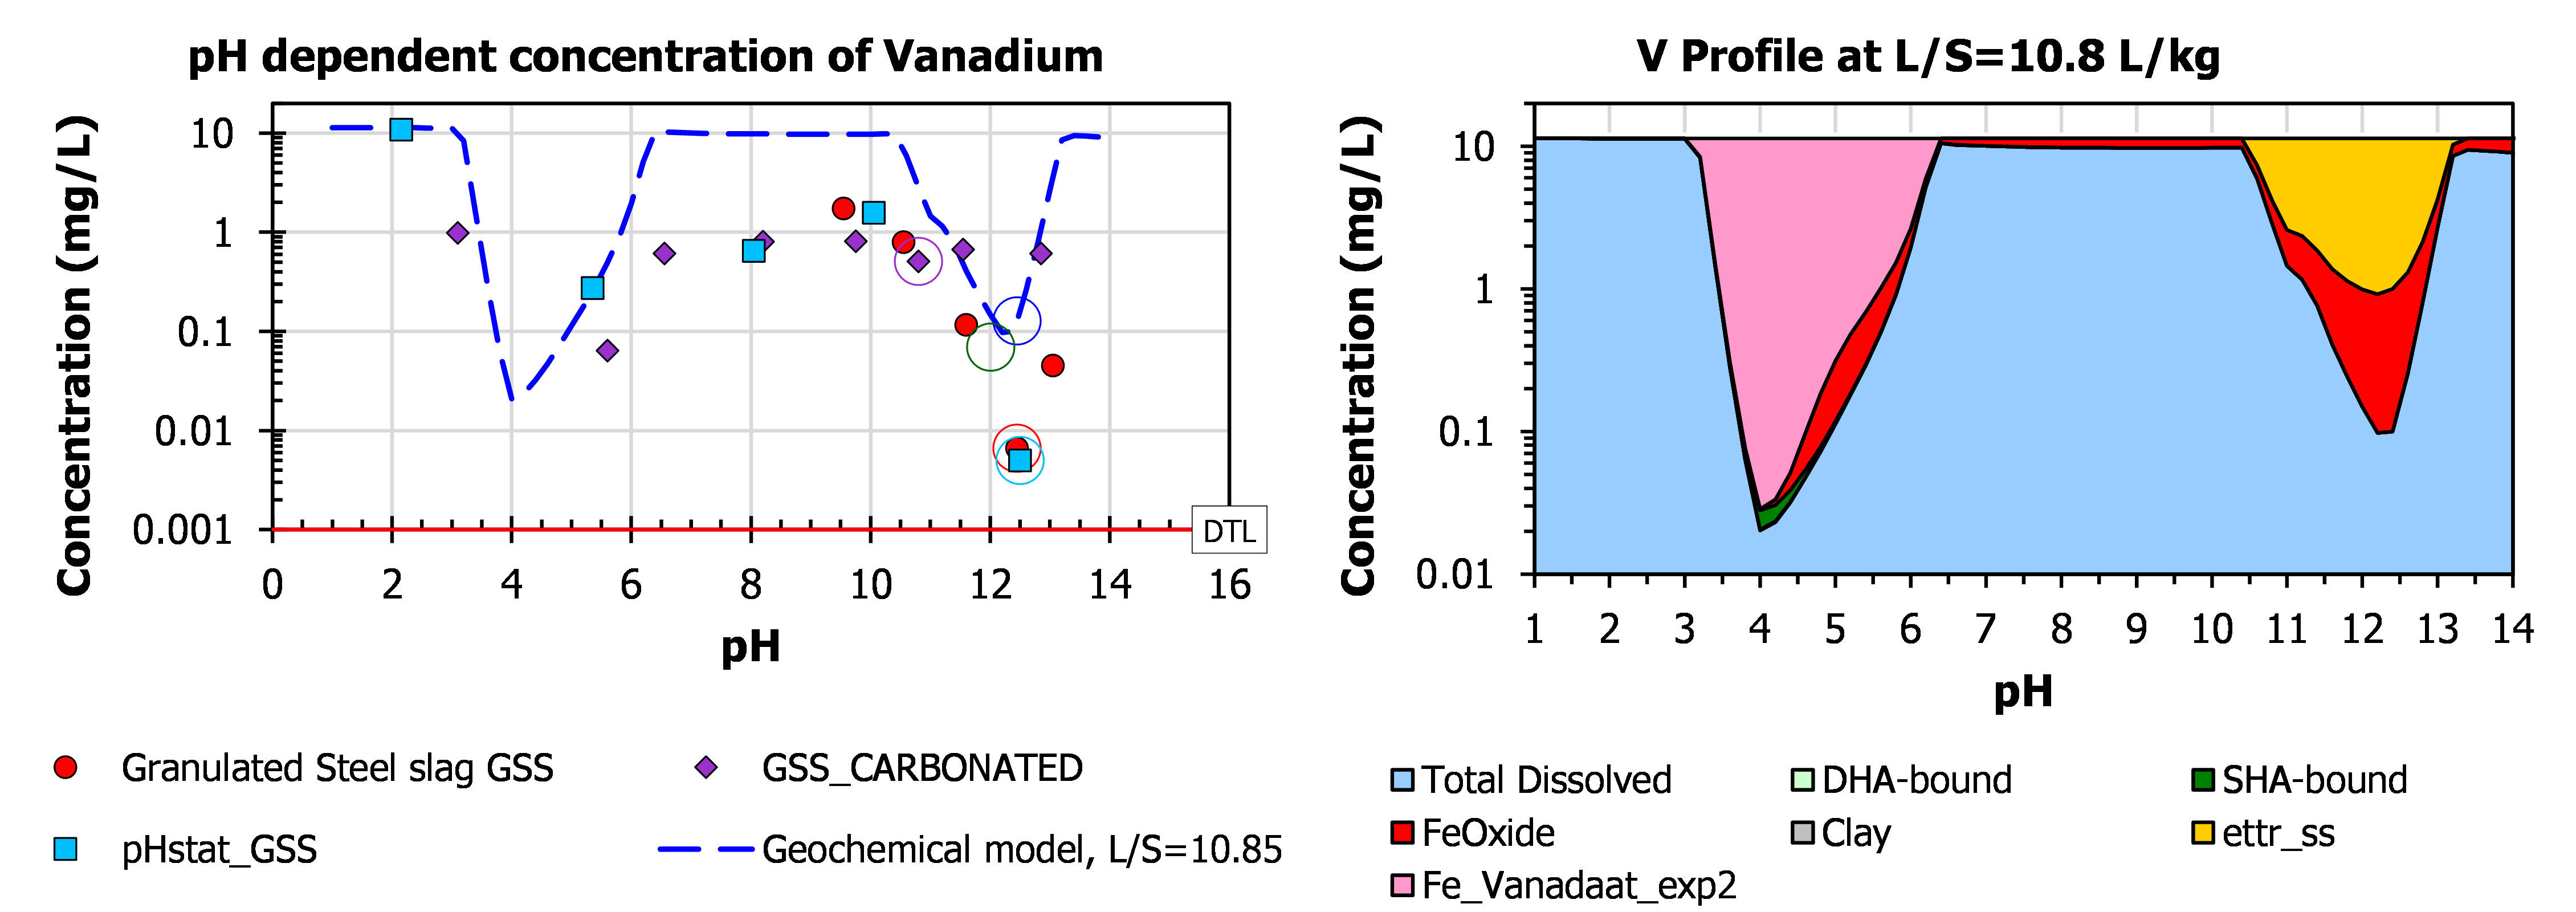
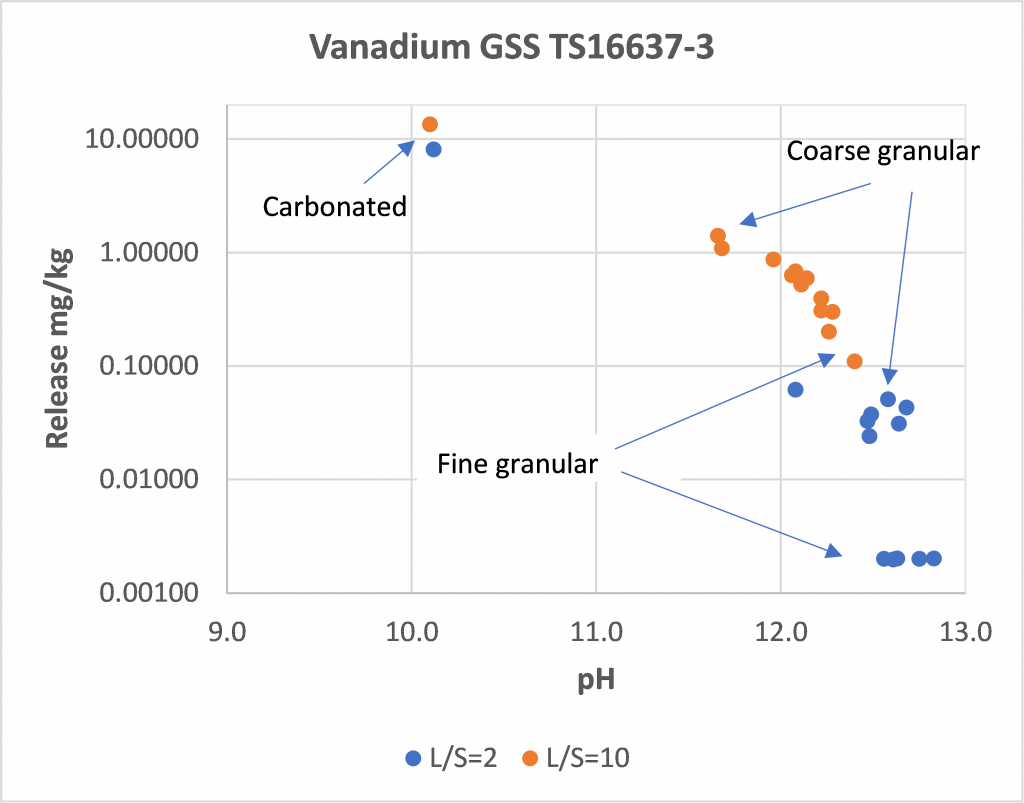
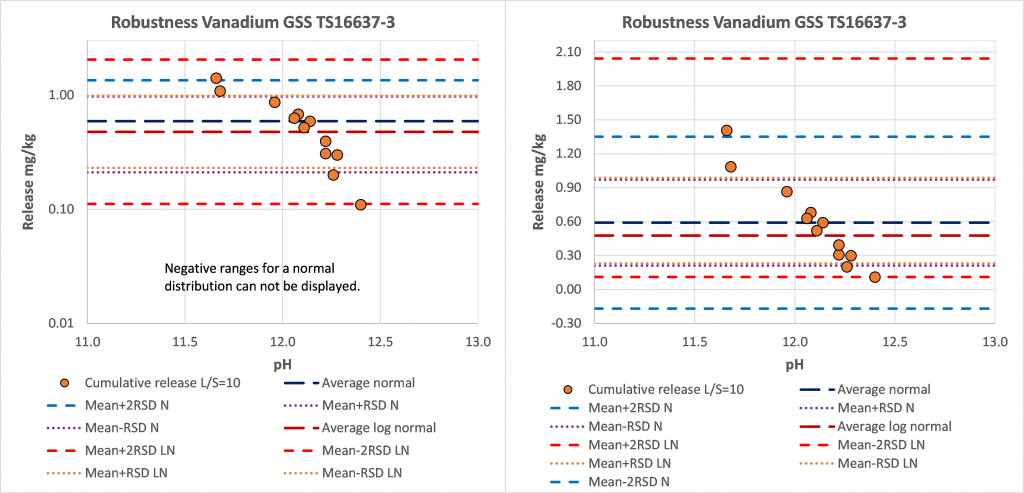
The values are indicative values of the attainable precision. In all validation studies a limited number of materials and parameters are tested. Consequently, for other materials and parameters, performance characteristics may fall outside the limits as derived from the respective validation studies. For inherently heterogeneous materials, the deviations can be larger than the values given in the tables. With respect to leaching a special situation applies, when the leaching happens to take place in a pH domain where relatively steep concentration gradients occur, which turns out be more common than generally realized. In this case, applying log-normal statistics is more appropriate.


RSD as a function of concentration

The performance data in the tables and graphs given above cannot be judged properly without considering the concentration levels in terms of content, eluate concentration or leaching test outcome. See separate information on repeatability (RSDr) and reproducibility standard deviations (RSDR) as obtained in these validation studies for organic and inorganic substances for content and eluate analysis as a function of concentration, which complements the tabulated performance data.


Low concentration levels in validation

For instance, the high uncertainty in PCB obtained by EN 17331 is caused by the low concentration level in the construction product used in the intercomparison validation. The concentration level is around 10 µg/kg for the individual PCB congeners analysed and 0.06 mg/kg for the sum of PCB’s. The Dutch limit for the sum of PCB’s is 0.5 mg/kg, which implies that an RSD of 60 % ensures that the information to decide if the sample exceeds the limit can be taken without a problem. From the RSDr and RSDR for the content of PCB as a function of concentration, it is also clear that, when the PCB concentration would reach 0.5 mg/kg in a construction product, the RSDR would be around 30 % and the RSDr around 8 %. This is the current state of the art of analysis of PCB content in materials and products and fit for purpose.


Sharp gradients

Leaching and steep concentration changes as a function of pH – consequences for statistical evaluation

Validation data are assumed to be normally distributed to allow gaussian statistics to be applied. In leaching this condition may not be fulfilled in all cases. When a steep concentration gradient exists over a relatively narrow pH range, concentrations may change substantially more than expected.

Below leaching results from the validation study of EN 12457 are shown. A pre-qualification test was done to ensure that measurable concentration would be obtained. Then a homogeneity test was carried out on sub-samples from the large batch, from which aliquots were drawn for distribution to participating laboratories. In ruggedness validation, experimental conditions were varied to determine the sensitivity of test results to specified test conditions. Finally results from intercomparison were evaluated. Results obtained in each of these levels in the validation program have been plotted as a function of pH for SO4, Zn, Mo, Cu and Pb. For SO4, Zn and Pb, there is a significant pH change within the pH domain, in which the testing took place. Solubility control by mineral and sorptive phases (hydrated ironoxide, dissolved and particulate matter, clay) is the cause for these changes in release behaviour.

Validation of EN 12457-2 for Sulphate


Validation of EN 12457-2 for Zinc


Validation of EN 12457-2 for Molybdenum


Validation of EN 12457-2 for Copper


Validation of EN 12457-2 for Lead.


Changes in material properties during storage

In the two figures below, it can be noted that during the storage of MSWI bottom ash the pH dropped due to uptake of CO2 from the atmosphere. The biggest change took place between the pre-qualification tests and the homogeneity testing. The effect is most noticeable for Pb. This implies that real life samples are not always stable. This is particularly relevant for alkaline materials, but oxidation may also be a factor to be reconned with. When data are skewed like this the question can be passed whether normal statistics should apply, or a log-normal distribution is more appropriate. In this case, a log-normal distribution is more meaningful, as other ways lower 90 or 95 % boundaries can become negative, while handling results as log-normal data will produce realistic concentration ranges.

t=0 prequalification
t=3 months homogeneity testing
t=4.5 months ruggedness testing


Normal or log normal statistics

Normal or log-normal statistics.

The leaching of V from steelslag illustrates that leaching may have to be treated using log-normal statistics instead of normal statistics. This occurs when the range between highest and lowest values in a population are systematically divided but cover more than an order of magnitude. This feature is not a rare occurrence but may show up for several elements in situations where the leachability changes drastically over a relatively small pH range. The V leaching from steelslag is an illustration of this feature. Coarse granular material features a lower pH than fine grained material and hence leaching of V is higher from coarse granular, than from fine granular material.  In figure 1 results of robustness data on CEN/TS 16637-3 are placed in perspective to EN 14429 data showing that the leaching of V is strictly solubility controlled. In figure 2 results from geochemical modelling of steelslag is given to illustrate the mineral phases controlling V solubility. Substitution of V for sulphate in ettringite largely controls V solubility at pH > 9.  Other substances e.g. oxyanions, like sulphate will show a similar behaviour in this pH domain as ettringite controls oxyanion solubility in the pH range 10 – 13.


Figure 1 Leaching of V from steelslag using TS16637-3 in relation to EN14429 (pH dependence).


Figure 2 Geochemical modelling of V leaching from Steelslag (GSS) showing solubility controlling phases for V.


In the table below data for CEN/TS 16637-3 are given for a range of test conditions. In figure 3 the results are show as a function of pH covering an order of magnitude.


Table 1 Data for CEN/TS 16637-3 are given for a range of test conditions.


Figure 3. Leaching of V from steelslag at different flow rates and different particles sizes as obtained from robustness validation.


In the figure below the difference between normal and log-normal evaluation of V test data is illustrated.

Figure 4. Statistical evaluation by normal and log-normal statistics.

In the latter case meaningful results are obtained for all confidence intervals, while normal statistics may lead to smaller than values in some cases.


Normal Average normal 0.59
Mean+2RSD Normal 1.35
Mean-2RSD Normal -0.17
Mean+RSD Normal 0.97
Mean-RSD Normal 0.21
Log-normal Average Log-normal 0.48
Mean+2RSD Log-normal 2.04
Mean-2RSD Log-normal 0.11
Mean+RSD Log-normal 0.99
Mean-RSD Log-normal 0.23


Observations:

Mean +/- RSD ranges are close for both normal and log normal distribution

Negative ranges cannot be displayed in a log scale. With this type of data, it is obvious that a log-normal distribution is more appropriate.

Lower range for Mean – 2*RSD is negative for a normal distribution, while a log-normal distribution gives meaningful results.

From CEN/TR 15310 par 4.3.1: “A key element in testing programme design is a requirement to understand the main components of variability in the population being sampled.” This includes in case of leaching pH sensitivity and verification if pH plays a role in the evaluation of leaching results!


Return to Homepage