A stepwise procedure using leaching data and scenario-based dynamic modelling of the source, transport and impact of substances has been used to establish a direct relationship between the behaviour of inorganic contaminants released by leaching from waste in a landfill and the risk these contaminants may pose to the quality of downstream groundwater. The principle is illustrated in Figure 1.
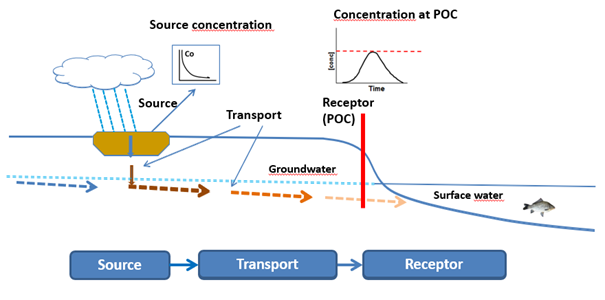
Figure 1: The principle of the scenario-based model calculations.
The approach used in the development of criteria for acceptance of waste at landfills may best be described in terms of a series of consecutive steps (Hjelmar et al., 2001):
First a decision is made concerning the primary target(s) or point(s) of compliance (POC), e.g., the quality of groundwater at one or more point(s) downstream of the landfill.
Quality criteria are then selected for the groundwater and the physical characteristics of the landfill and environment scenarios are selected and described. The environment scenario includes the net rate of infiltration and a hydrogeological description of the unsaturated and saturated (aquifer) zones upstream, below and downstream of the landfill.
The source of the various contaminants is subsequently described in terms of the flux of contaminants as a function of time (or the liquid to solid ratio, L/S) based on leaching data and the hydraulic scenario defined. The leaching is approximated mathematically as an exponentially decreasing function of L/S, using a component-specific constant, kappa (κ).
Then the migration of the contaminants from the base of the landfill through the unsaturated zone into the groundwater and through the aquifer to the POC is modelled including only reversible, sorption-based contaminant/subsoil interaction processes and using proven and accomplished flow and transport models. Selected Kd-values are used for each contaminant to calculate and incorporate the retardation factors (assuming linear sorption isotherms).
Based on these “forward” calculations so-called “attenuation factors” (the ratio between peak concentration as modelled at the groundwater POC and the source peak concentration at the base of the landfill) are determined for each contaminant and each scenario.
The attenuation factors are then used for “reverse” calculation of the values of the source term corresponding to the selected groundwater quality criteria for each contaminant at a particular POC. Due to the use of linear sorption isotherms this is quite simple. The final step consists of transforming the resulting source term criteria to a limit value for a specific test using the κ-based exponential description.
The procedure described is based on many assumptions, all of which are not always fulfilled. It is, however, possible to test and assess the sensitivity of the calculations to the assumptions and take this into account when limit values are set.
The final outcome of the modelling efforts has been used as basis for the negotiations between EU Member states to derive the final Landfill acceptance criteria that ultimately were implemented in EU legislation (CEC, 2003).
The methodology as described when used to set criteria for acceptance of waste to landfill only considers the risk to groundwater potentially used as a source of drinking water, but it can easily be expanded to also cover surface water. It can also be used to set criteria for utilisation of waste-derived aggregates under unbound conditions (see e.g. Hjelmar et al., 2013).
References
CEC (2003) Council Decision 2003/33/EC of 19 December 2002 establishing criteria and procedures for the acceptance of waste at landfills pursuant to Article 16 of and Annex II to Directive 1999/31/EC. Official Journal of the European Communities, 16.01.2003, L11/27-49.
Hjelmar, O., van der Sloot, H.A., Guyonnet, D., Rietra, R.P.J.J., Brun, A. & Hall, D. (2001). Development of acceptance criteria for landfilling of waste: An approach based on impact modelling and scenario calculations. In T.H. Christensen, R. Cossu and R. Stegmann (eds.): Sardinia 2001, Proceedings of the Eigth International Waste Management and Landfill Symposium, S. Margharita di Pula, Cagliari, CISA, Vol. III, pp. 712-721.
Hjelmar, O., van der Sloot, H.A., Comans, R.N.J. & Wahlström, M. (2013). EoW Criteria for Waste-Derived Aggregates. Waste Biomass Valor (2013) 4:809-819.
Emission limit values for inorganic components in stony and earthy building materials were derived for the revision of the Building Materials Decree in the Netherlands in 2007. Three key factors determine the emission limit value: (1) the environmental compartment under consideration with its dimensions, (2) the desired level of environmental protection and (3) the scenario applying to the intended use of the construction material. Emission limit values have been derived here from modelled concentrations in soil, groundwater and surface water. Two models were used for the vertical reactive transport through the soil profile and for retardation of components in the soil profile. The PEARL model was used for binding described by a linear distribution coefficient approach (Kd). The ORCHESTRA modelling framework was used for modelling binding that takes speciation and surface complexation into account. For surface water, a dilution factor was computed assuming a certain mixing zone, dependent on the size of the surface water. The socio-economic consequences of the proposed emission limit values have been estimated on the basis of information in a database containing results of leaching tests for construction materials. The alternatives proposed form the basis for a political decision-making process, where environmental protection was balanced with other socio-economic concerns.
OUTLINE OF THE METHOD FOR DERIVATION OF EMISSION LIMIT VALUES
The emission limit values are calculated in six steps, which are visualized in figure 1.
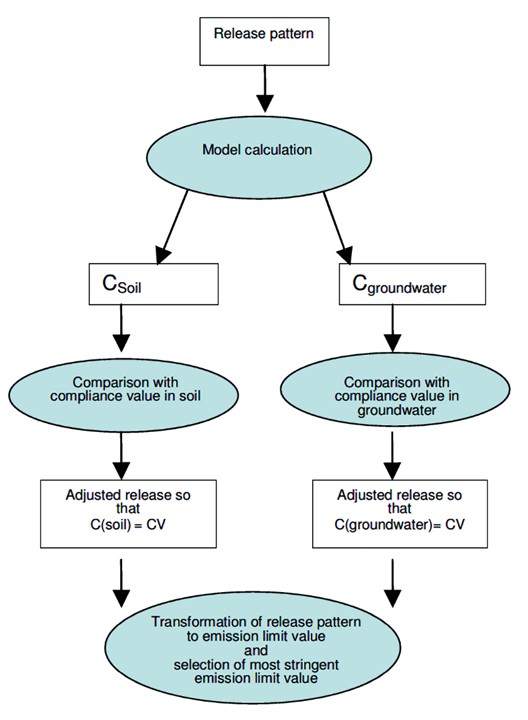
Figure 1. Outline of the calculation of emission limit values (CV=compliance value)
SOURCE TERM – The release pattern of substances from granular materials in constructions can be
described by equation 1.
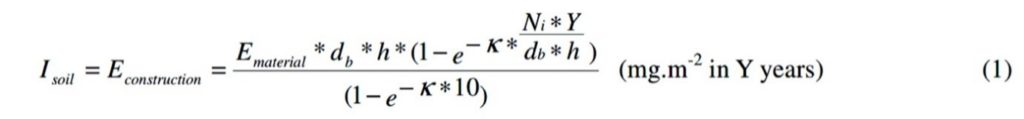
in which:
Isoil source term (mg/m2 per Y years);
Econstruction emission from a construction (mg/m2 per Y years);
Ematerial measured emission of material in a column test at L/S =10 (mg/kg);
db bulk density of a material (default 1550 kg/m3 )
h height of material in a construction (m);
κ, rate constant for release ;
Ni effective infiltration of rain (mm/years);.
Y time (years)
For granular building materials constructions with heights of 0.2, 0.5, 0.7 and 2
meters are simulated with and without isolation on top. For isolated constructions an
infiltration of 6 mm/year was assumed and for open constructions an infiltration of 300
mm/year.
MODELING BOUNDARIES – The simulation time was set at 100 years, which is a time window determined by policy considerations. The soil profile consists of 1 m unsaturated soil and 1 m saturated soil. The average groundwater level is 1 m below soil surface, being an average for the Dutch situation. The points of compliance were twofold: concentrations in the solid phase (mg/kg), i.e., the average concentrations in the upper 1m of the soil, and the average concentrations in the upper meter of groundwater (ug/l).
MODELING BY A LINEAR DISTRIBUTION COEFFICIENT APPROACH (KD) – The Kd approach has been applied using PEARL 2.2.2. The Netherlands has a great variety of soil types, ranging from poor sandy soils, to peat and marine clays. The choice of the value of the Kd is crucial for the computed soil and groundwater concentrations, and for the ultimate emission limit values. In order to guarantee a safe use of materials on all soil in the Netherlands, realistic worst-case Kd-values are selected from a collection of literature data.
MODELING SPECIATION AND SURFACE COMPLEXATION USING ORCHESTRA – A speciation and surface complexation model is applied for verification and validation of modeling with linear distribution coefficients. The ORCHESTRA model approach is able to compute adsorption of substances to several organic matter fractions (solid as well as dissolved organic matter fractions), clay and ferrous-oxides. The uncertainty of the intrinsic thermodynamic constants for these specific interactions is considerably less than the variability of Kd-values in soils. An advantage is that the adsorption can be computed for soils with different binding properties. In this approach, non-linearity of adsorption, competition between substances for adsorption sites and the influence of pH is accounted for. In order to represent a wide range of conditions in The Netherlands, an average sand, clay and peat soil have been selected from a large database with 465 real Dutch soil profiles.
RESULTS – The fact that these models have a very detailed output in time and in depth, raised the question on how to choose the modeling end points. After some trials with different depths, cut-off times and averaging windows the emission limit values were at last derived from annual average concentrations in 1 m soil and annual average concentrations in 1 m groundwater. A generic choice for the application height of granular materials was made of 0.5 meter. For soil, the endpoint is taken at the end of the simulation time, 100 years. For groundwater, the maximum annual concentration within a 100 year window is taken. On the one hand, the averaging method levels out many differences between the linear distribution model and the speciation/surface complexation model, thereby offering a robustness to the assessment. The results have ultimately led to quality criteria for building materials and construction products as produced and with isolation measures to limit infiltration. These limit values were based on the Orchestra model approach (i.e., based on chemical speciation). In a later stage, a very similar model approach with Orchestra was performed to establish emission limit values for soil and dredged sediment, as well as for landfills (Brand et al., 2016; Dijkstra et al., 2018).
More details provided in the references below.
Anja J. Verschoor, Johannes, J.P. Lijzen, Huub H. van den Broek, Rob F.M.J. Cleven, Rob N.J. Comans, Joris J. Dijkstra. Revision of the Dutch building materials decree: alternative emission limit values for inorganic components in granular building materials. 9th International Symposium on Environmental Geotechnology and Global Sustainable Development – 1-4 juni 2008 – Hong Kong.
Brand, E., de Nijs, T.C.M., Dijkstra, J.J., Comans, R.N.J., 2016. A novel approach in calculating site-specific aftercare completion criteria for landfills in The Netherlands: Policy developments. Waste Manag. 56. https://doi.org/10.1016/j.wasman.2016.07.038
Dijkstra, J.J., Van Zomeren, A., Brand, E., Comans, R.N.J., 2018. Site-specific aftercare completion criteria for sustainable landfilling in the Netherlands: Geochemical modelling and sensitivity analysis. Waste Manag. 75, 407–414. https://doi.org/10.1016/j.wasman.2018.02.002
Dijkstra, J.J., Van Zomeren, A., Susset, B., 2013. Technical principles underlying limit values for release of substances for the percolation test TS3: comparison DE and NL. ECN, The Netherlands, and Consulting Office SiWap Bernd Susset, Germany.
Regulatory approaches
Uncertainty
Screening level assessment
Site and scenario specific evaluations
Treatment evaluation
Source term modelling
Field site assessment
Laboratory – Field comparison
Complex field conditions
Waste classification
